September 13, 2020
Viewshed From Peaks
214 words | 1-min read |
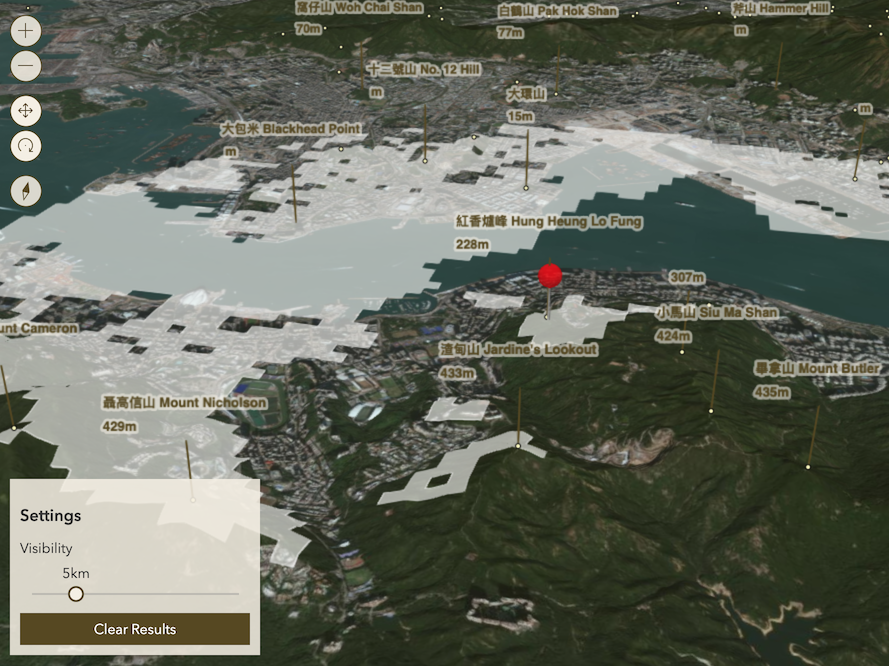
I made an interactive web map a few months before as a little project to practise some Javascript and web mapping skills.
Play the Interactive MapThe project was originally a random thought when I was on a hike to Lion Rock on June.
Most of the tasks I’ve been doing are data analysis and some static data visualisations. Even for interactive web maps, I have only used the web apps already provided in ArcGIS Online. They are some ready-to-go applications - once you pushed the spatial data to the online cloud, you just need to add the data to the application template. I would say those applications serve 90% of the common tasks.
Still, I would like to try making a custom web map with javascript. Thus I made this web map.
The base of the code is from the code sample of computing viewshed available on ESRI’s website. The base of the web map is also of course comes from the code sample. I spent most of the time reading and trying to understand how those listener functions are doing. Those view.on() and view.goTo() functions takes me a while to understand what they are doing.
Still need more time to consolidate my concepts on the async properties related to client-side mapping.