December 03, 2020
Accuracy & Resolution of Spatial Data
942 words | 4-min read |
Just when I was doing some researches in living density for some map-making projects, I have been thinking about the issue of data accuracy in respect to data resolution again. I used these raster dataset for some recent map makings…
- A 5m-resolution digital terrain model (DTM) provided by the Lands Department of Hong Kong
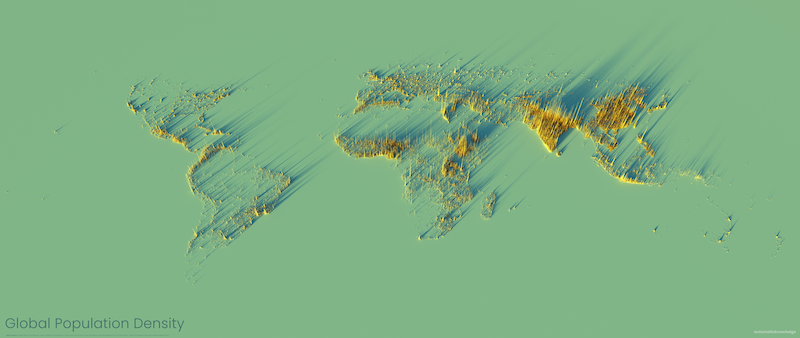
- A 3-arc-second-resolution (~100m at equator) global population raster from WorldPop
- A 30m-resolution land use classification raster of Japan
They make me can’t stop thinking about this issue again:
To what extent would you classify a raster is “high-resolution” enough?
The high living density of Hong Kong
The population and development density of Hong Kong is outrageous. It is common to have residential towers higher than 40 storeys, land lot with plot ratio larger than 10, and a giant residential tower inhabiting more than 2k residents. Even compared to other metropolitan area around the world, you could hardly find development density with these scale. High-rise towers are common in the financial districts, yet not for residential towers. A normal apartment house in Tokyo or Taipei would have at most around 10-15 storeys.
When you step outside of the King’s Cross Station in London, most of the apartments on the two side of the streets are 3-4 storeys. When you are taking a walk in Akihabara, Tokyo, you will find the commercial buildings are just 7-8 storeys. If you walk into the alleys and step into those residential areas, the domestic blocks are usually 3-5 storeys high. That’s why one of my friends working in Japan said her Japanese colleagues find a hard time to imagine her flat in Hong Kong is at the same height of the Tokyo Tower Observation Decks.
Data resolution, relative to size of study area
Mapping some nationwide matters usually means you have to collect lots of data as the nation in general covers a large area. Yet, on the other hand, it implies data resolution required will not be that high compared to mapping a district and city.
In addition, the lower living density makes the spatial resolution need not to be extremely high. The high living density makes the accuracy of data counts. The data required for urban analysis in the context of Hong Kong requires data with BOTH high resolution and high precision. This is always a pain in the neck for me.
When doing some quick data projects for other cities, there would have some readily available data source. Doing territorial analysis for continental countries like USA and Japan with terrain swiping across 20 degrees of the earth, data resolution of 1 km would consider “highly-accurate” and “in high resolution”.
The case of Hong Kong is completely different. In my definition, I would consider a raster dataset with resolution of 50 m “somehow precise”. My rule of thumb of data resolution required to create some accurate district-scale analysis for policy actions would be 10m.
A normal street block in old developed area of Hong Kong is around 50 m x 50 m. So, would a land use raster with resolution of 50m useful for me? Probably not. That’s what you could find inside one single street block:
- A few Tong Laus of 3-5 storeys
- A piece of vacant land
- One pocket-size sitting-out area
- A new 40-storey residential tower that is just redeveloped
How should I classify this street block? To be more exact, does this 50m x 50m grid shown of the raster represent the actual urban land use well? Well, I don’t think so. I would say that the accuracy of the land use grid has to be at least 20 m. Otherwise, you cannot conduct an accurate analysis to understand the characteristics of the study area. The study area for planning projects HAS to be that small.
Fault tolerance rate in planning
Moving facilities by just 50-100 m away could already create tremendous issues to the city. This is what my urban designer friend once said “Planning in Hong Kong cannot bear any large mistakes”.
If you are planning for new districts with the size in terms of km^2, you can save your project by adding some new spatial project “fixes” easily, as the place is large enough to add some extra projects. I would call these projects have a high “fault tolerance rate” - if you do something wrong, fixing it is not that hard.
I would say the “fault tolerance rate” of planning in Hong Kong is nearly 0. If you take a wrong action, not only you cannot revert it, but it will also be too hard to add new “patches” and “fixes”.
If you add a wrong fix, the whole urban tower will be a step closer to falling down.

This could a possible response when the city planning goes unexpected:
In other cities:
We did sth wrong? No problem! Find a new site to build a new one!
In Hong Kong:
We did sth wrong? Maybe find a new piece of land… wait do we have land available?
With the limited available land and large amount of residents, the master planning game of the urban Hong Kong is probably in the level of “Inferno”.
Advantages of mapping dense cities
I would still find an advantage of conducting spatial analysis in such a small area - projection doesn’t matter much (which is also the reason why I still can’t have a full understanding about map projections).
Someday I might want to map Gibraltar or Liechtenstein to see whether I will suffer the same pain.
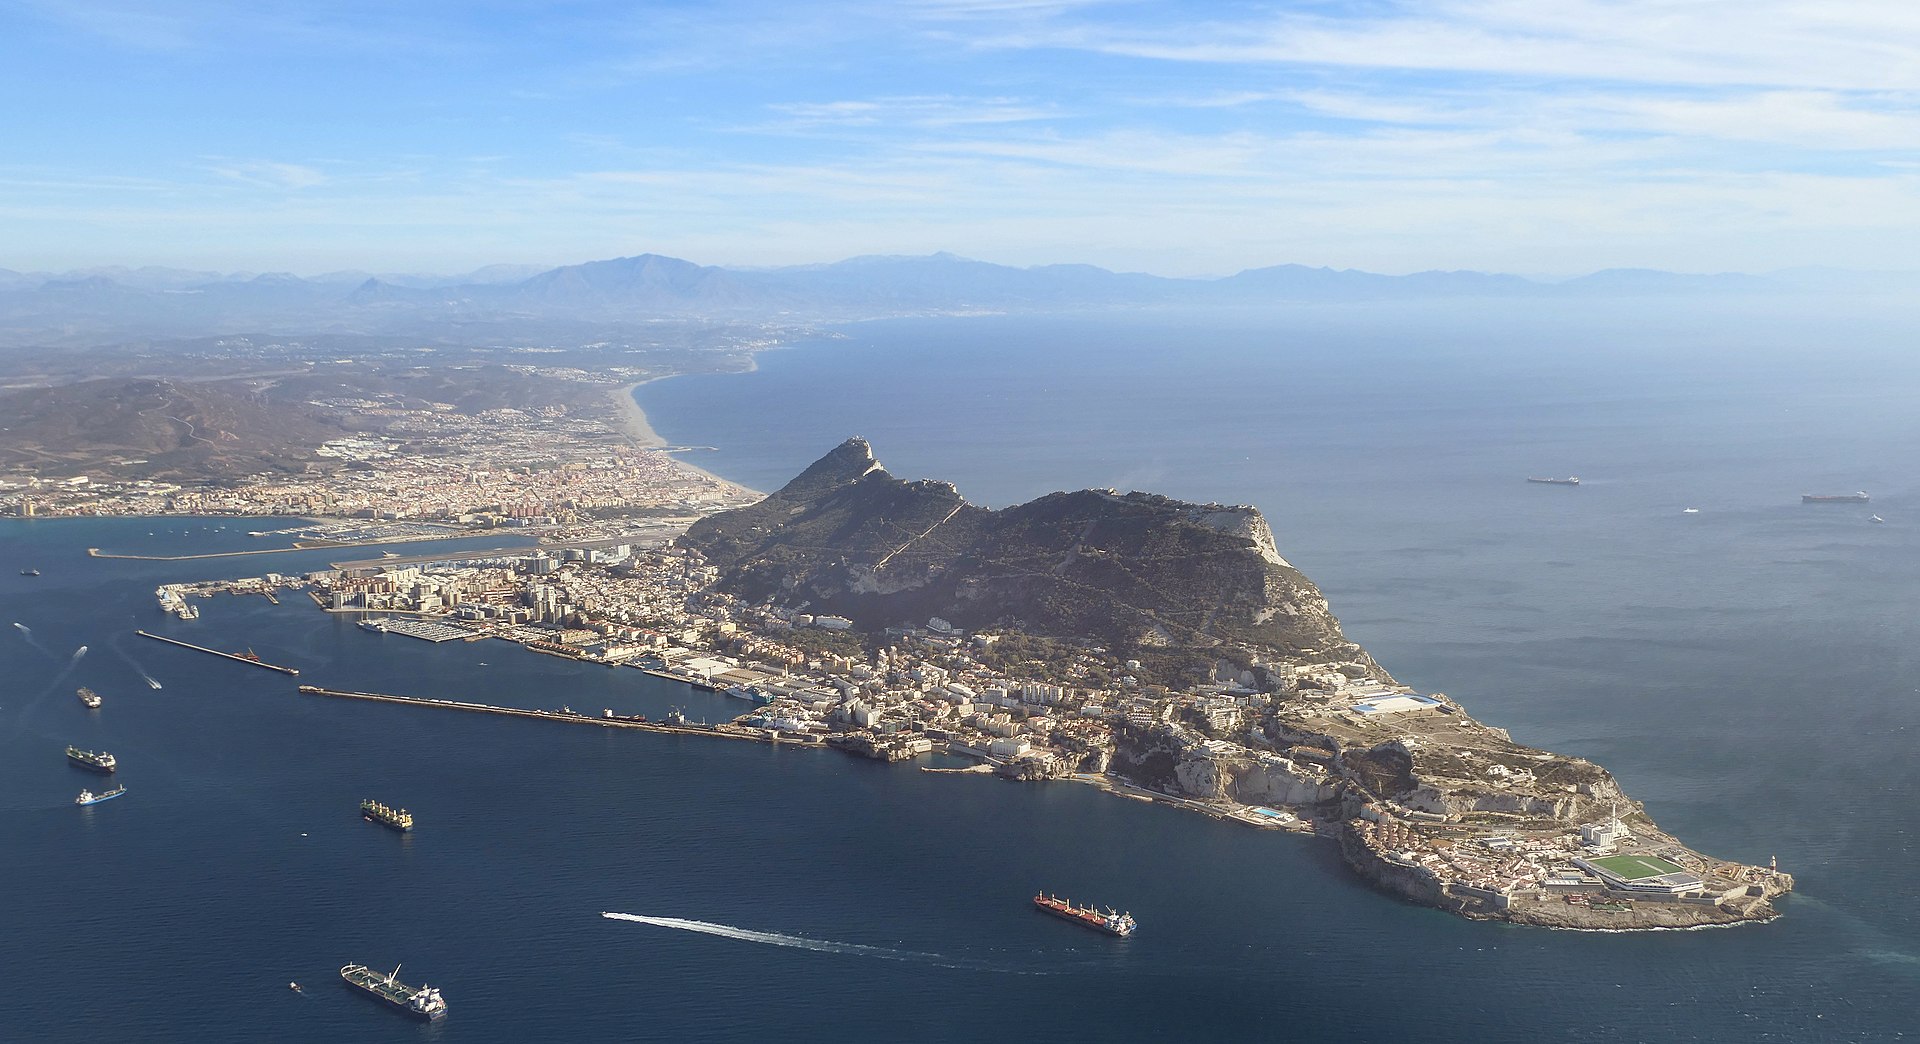 Image Credit: Adam Cli
But I hope I could have a chance to visit Gibraltar.