March 16, 2021
Writing markdown in shiny
Escaping from writing raw HTMLs and numerous `tags$`
1261 words | 6-min read |

TL;DR
Annoyed by writing raw HTMLs in a shiny app and want to write markdown instead? Put the paragraphs in a separate markdown file and use htmltools::includeMarkdown to render it in shiny.
I have been developing a new shiny app lately. This time, I tries to take a “scrollytelling” approach to present the data and charts. This means I have to write a bunch of paragraphs (arghhhh).
Following are some explanation paragraphs I drafted with markdown and my desired view in the browser.
I: Introduction
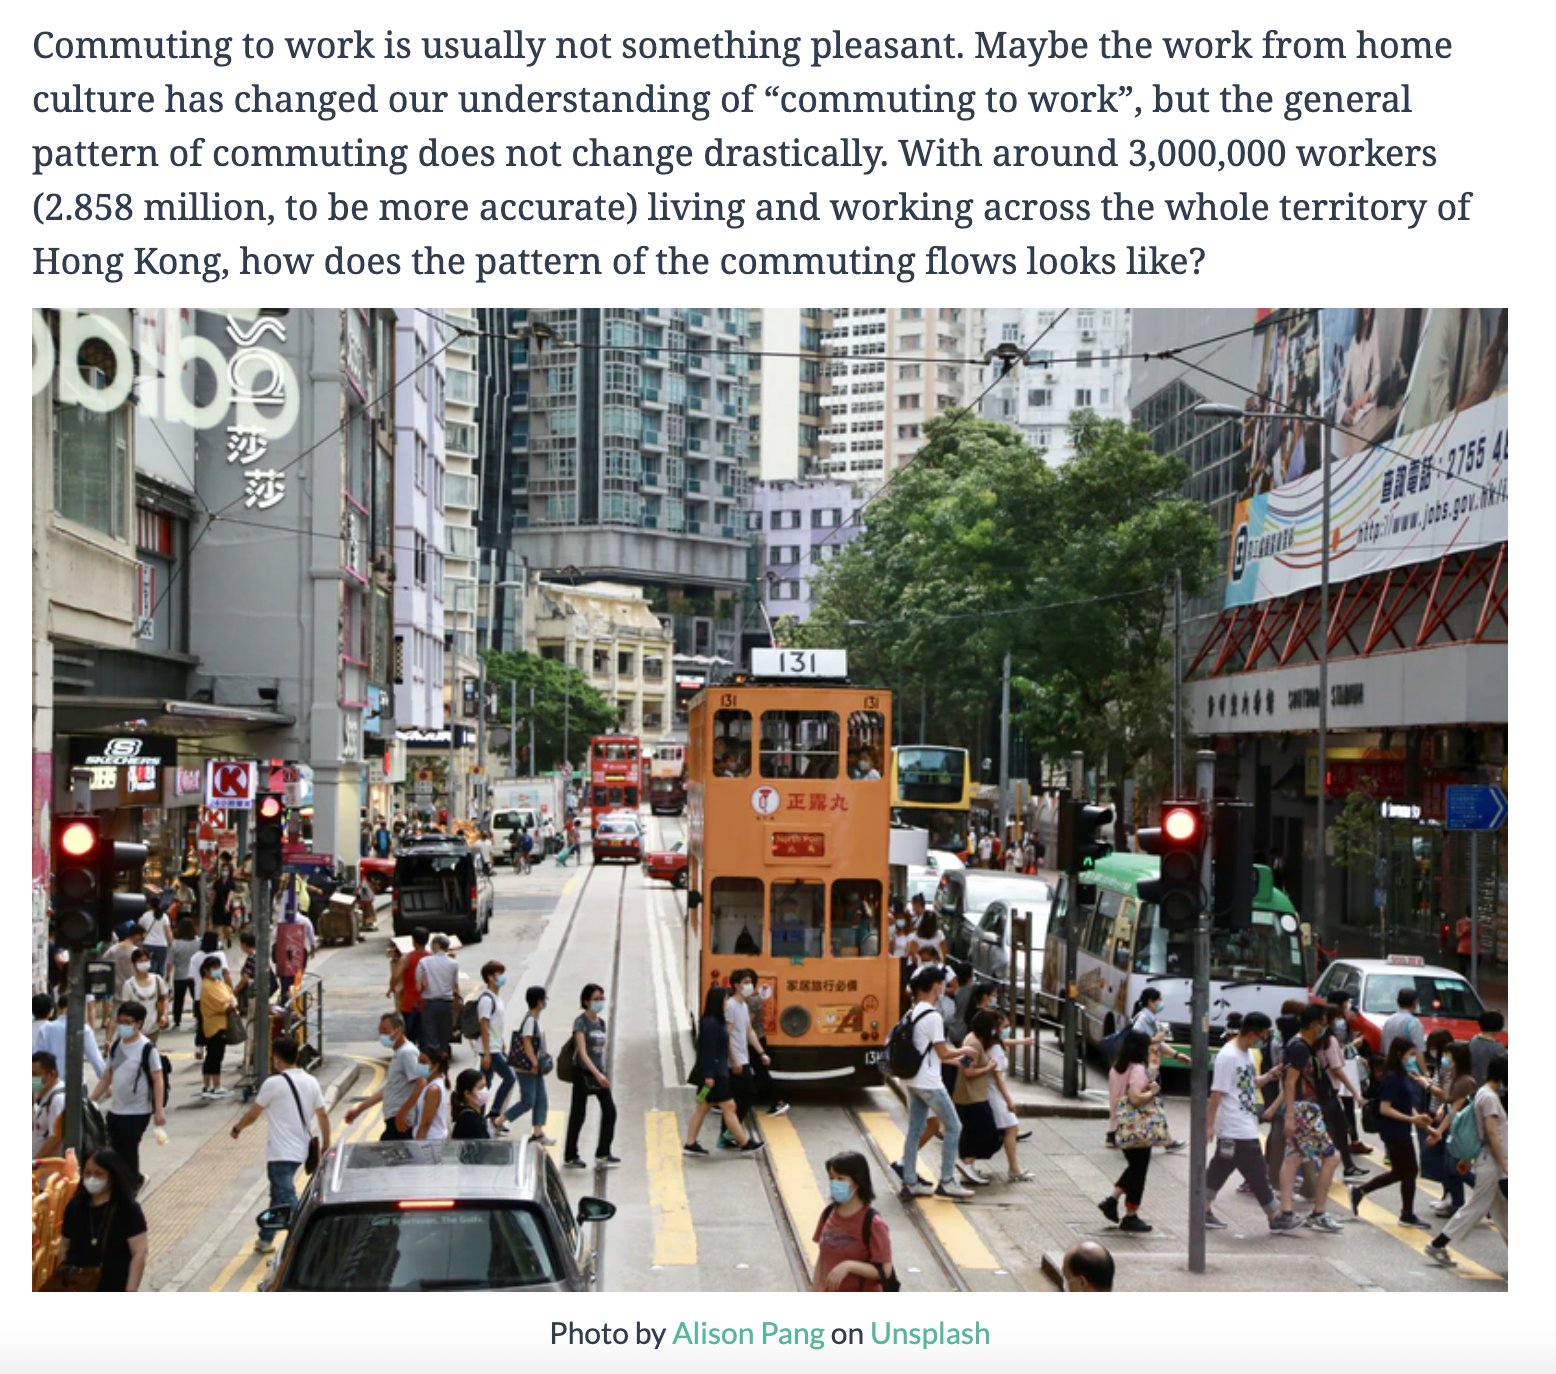
Commuting to work is usually not something pleasant. Maybe the work from home culture has changed our
understanding of "commuting to work", but the general pattern of commuting does not change drastically. With around
3,000,000 workers (2.858 million, to be more accurate) living and working across the whole territory
of Hong Kong, how does the pattern of the commuting flows looks like?
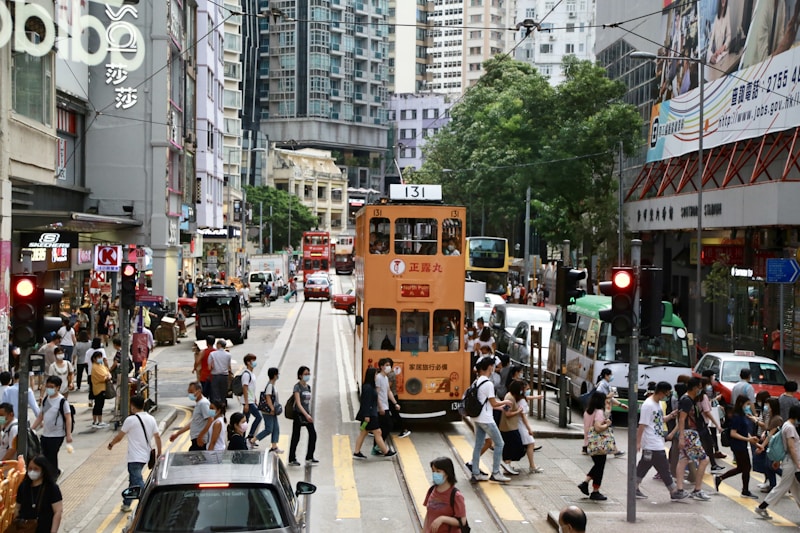
<figcaption><span>Photo by <a href="https://unsplash.com/@alisonpang">Alison Pang</a> on <a href="https://unsplash.com/s/photos/hong-kong-bus">Unsplash</a></span></figcaption>
II: Explanation on reading heatmap
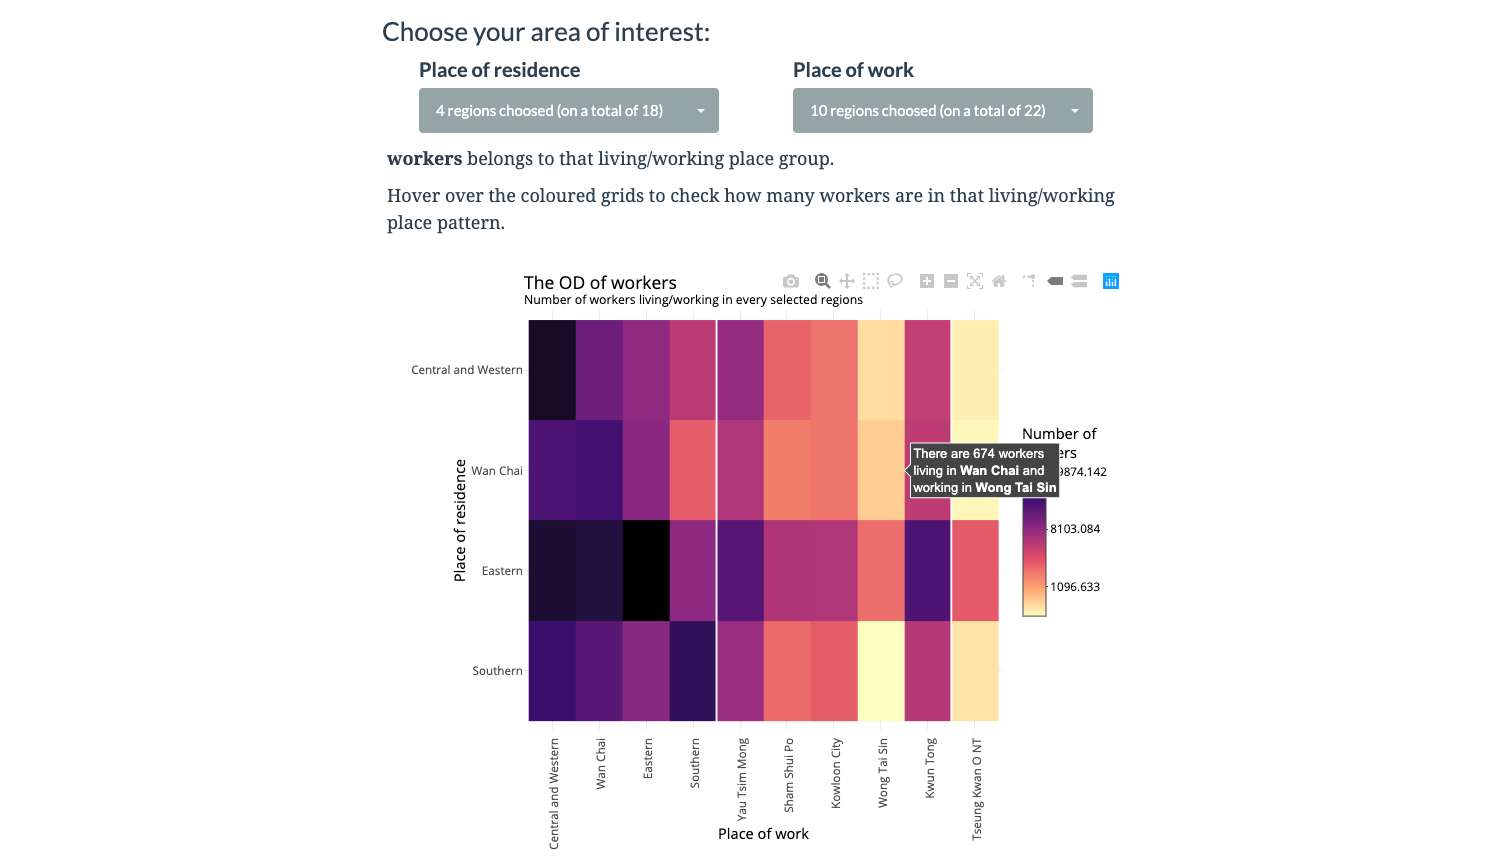
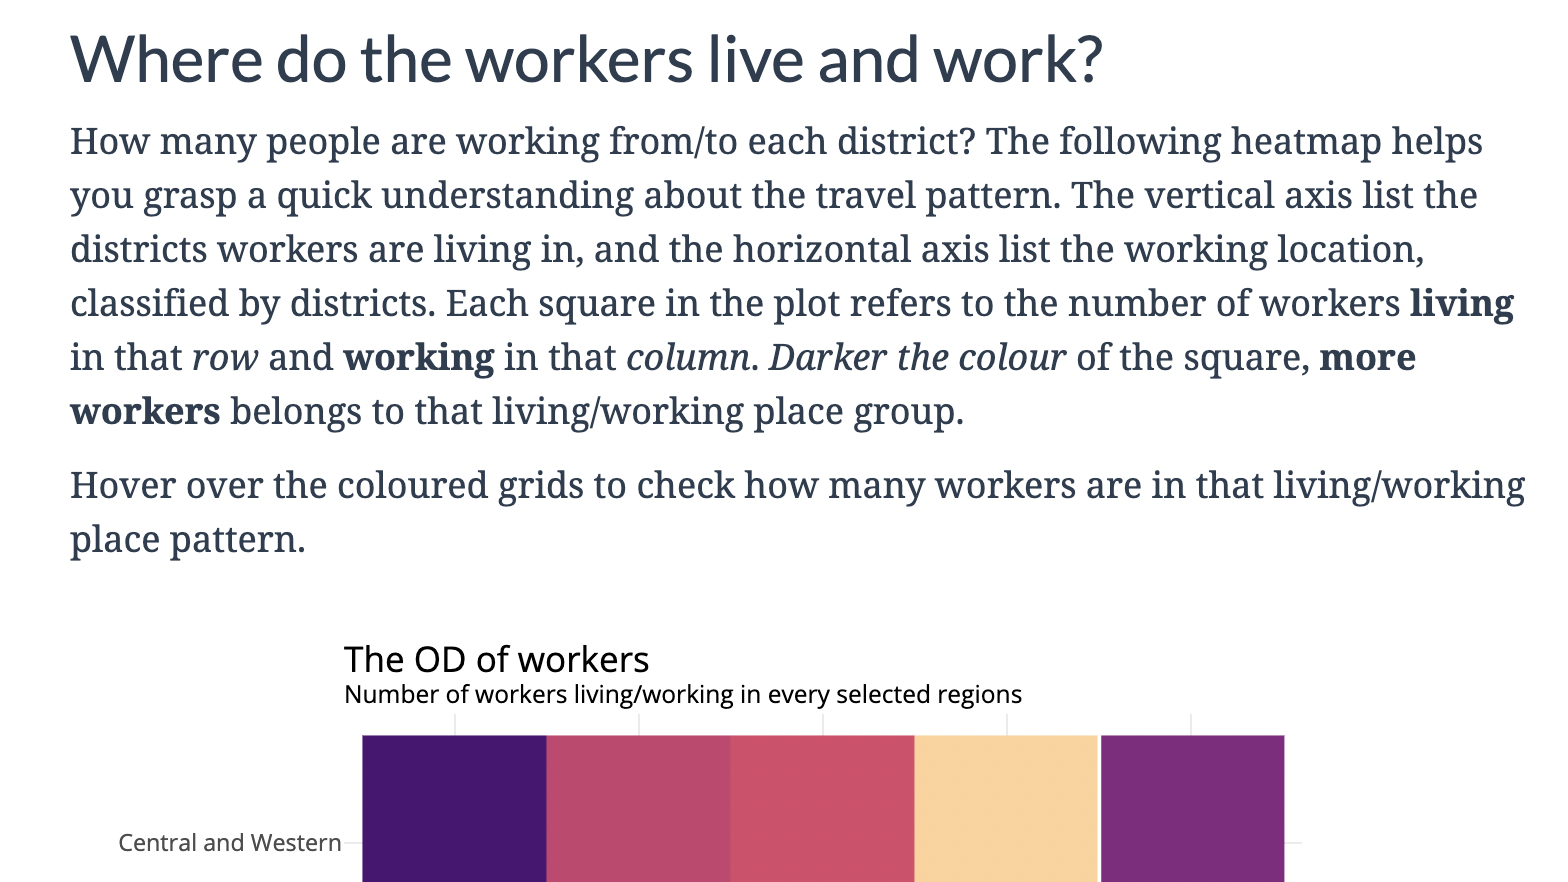
## Where do the workers live and work?

How many people are working from/to each district? The following heatmap helps you grasp a quick understanding
about the travel pattern. The vertical axis list the districts workers are living in, and the horizontal axis
list the working location, classified by districts. Each square in the plot refers to the number of workers
**living** in that *row* and **working** in that *column*. *Darker the colour* of the square, **more workers**
belongs to that living/working place group.

Hover over the coloured grids to check how many workers are in that living/working place pattern.
III: Explanation on reading sankey plot
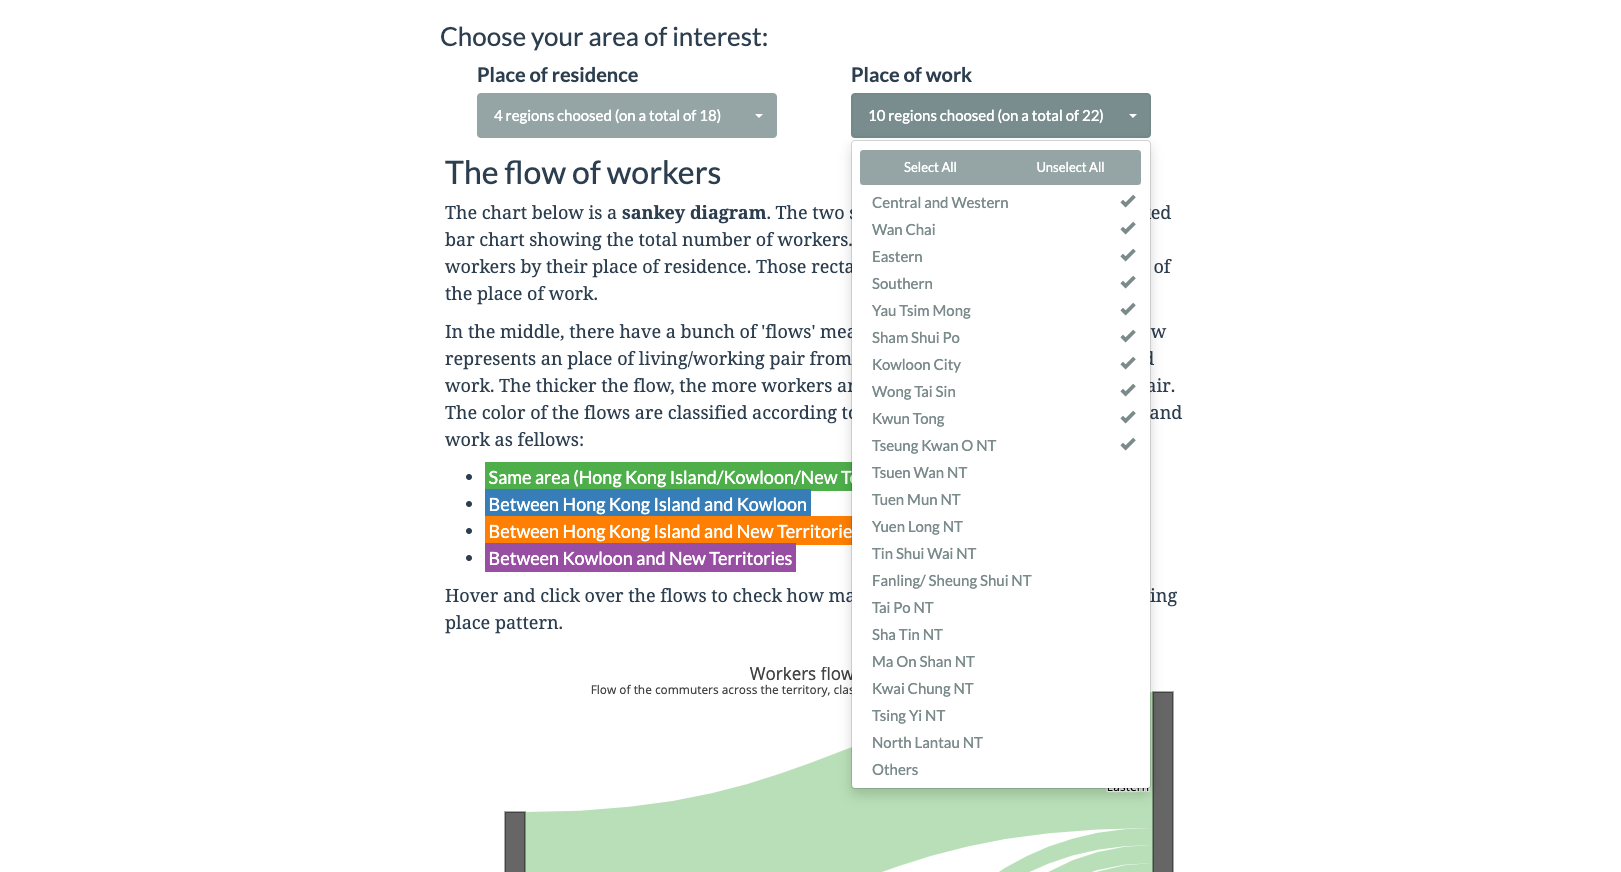
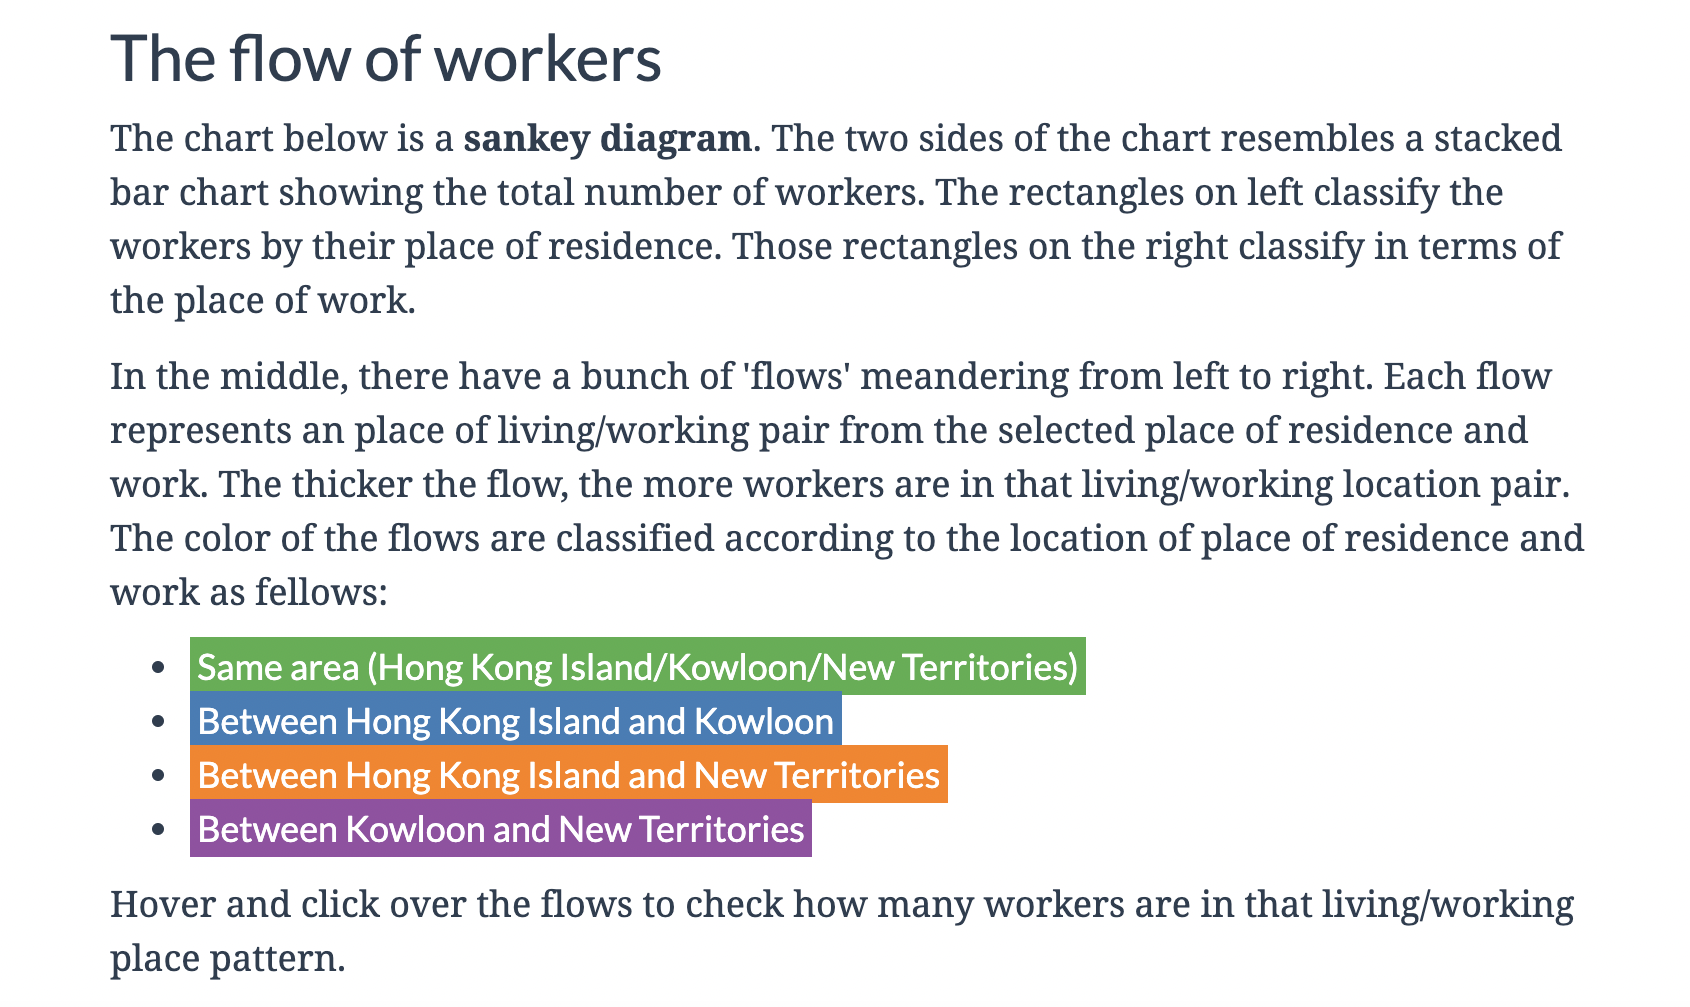
## The flow of workers

The chart below is a **sankey diagram**. The two sides of the chart resembles two stacked bar charts showing the total number of workers. The bar on *left* group the workers by their **living place**, while the *right* group by their **working place**.

In the middle, there have a bunch of 'flows' meandering from left to right. Each flow represents a combination of living and working place. The *thicker* the flow, the **more workers** are in that living/working location pair. The *colour* of the flows are classified according to their travel patterns as follows:

- <mark style="color:#ffffff; background-color:#4daf4a">Same area (Hong Kong Island/Kowloon/New Territories)</mark>
- <mark style="color:#ffffff; background-color:#377eb8">Between Hong Kong Island and Kowloon</mark>
- <mark style="color:#ffffff; background-color:#ff7f00">Between Hong Kong Island and New Territories</mark>
- <mark style="color:#ffffff; background-color:#984ea3">Between Kowloon and New Territories</mark>

Hover and click over the flows to check how many workers are in that living/working place combination.
Problem with using tags from htmltools
How to write the same paragraphs in a shiny web app? htmltools package provides some HTML Builder Functions for constructing HTML documents. You need to wrap the text using the equivalent html tag. Instead of writing <p>paragraph</p> or <h2>H2 title</h2>, you need to write p("paragraph") and h2("H2 title").
So this is how it looks when using the tags function to write the same paragraphs:
I: Introduction
h1("The great migration of workers"),
h3("Where do the workers working in your district live, and where do the workers living in your districrt work"),

br(),

p("Commuting to work is usually not something pleasant. Maybe the work from home culture has changed our
  understanding of \"commuting to work\", but the general pattern of commuting does not change drastically. With around
  3,000,000 workers (2.858 million, to be more accurate) living and working across the whole territory
  of Hong Kong, how does the pattern of the commuting flows looks like?"),

br(),

img(src = "https://images.unsplash.com/photo-1594313724910-ed94feda812d?&auto=format&fit=crop&w=800", align = "center"),

tags$figcaption(HTML("<span>Photo by <a href=\"https://unsplash.com/@alisonpang\">Alison Pang</a>
        on <a href=\"https://unsplash.com/s/photos/hong-kong-bus\">Unsplash</a></span>"), align = "center"),

br(),
II: Explanation on reading heatmap
h2("Where do the workers live and work?"),

p("How many people are working from/to each district? The following heatmap helps you grasp a quick understanding
  about the travel pattern. The vertical axis list the districts workers are living in, and the horizontol axis
  list the working location, classified by districts. Each square in the plot refers to the number of workers",
  tags$b("living"), "in that", tags$i("row"), "and", tags$b("working"), "in that", tags$i("column"), ". ",
  tags$i("Darker the colour"), "of the square, ", tags$b("more workers"), "are in that living/working place pattern."),

p("Hover over the coloured grids to check how many workers are in that living/working place pattern."),
III: Explanation on reading sankey plot
p("The chart below is a sankey diagram. The two sides of the chart resemables a stacked bar chart showing the total
  number of workers. The rectangles on left classify the workers by their place of residence. Those rectangles on
  the right classify in terms of the place of work."),

p("In the middle, there have a bunch of 'flows' meandering from left to right. Each flow represents an place of
  living/working pair from the selected place of residence and work. The thicker the flow, the more workers are
  in that living/working location pair. The color of the flows are classified according to the location of place of
  residence and work as fellows: "),

tags$ul(
  tags$li(tags$mark("Same area (Hong Kong Island/Kowloon/New Territories)", style = "color:#ffffff; background-color:#4daf4a")),
  tags$li(tags$mark("Between Hong Kong Island and Kowloon", style = "color:#ffffff; background-color:#377eb8")),
  tags$li(tags$mark("Between Hong Kong Island and New Territories", style = "color:#ffffff; background-color:#ff7f00")),
  tags$li(tags$mark("Between Kowloon and New Territories", style = "color:#ffffff; background-color:#984ea3"))
),
This does the job, but annoys me (at least) in the following aspect:
Writing special characters requires trailing backslash (e.g.
""as\" \") in order to escape the colon marks, just like escaping special characters in LaTeX and MathJaxWriting bold and italic is troublesome: I have to write so many
tags$bandtags$iand cut the whole sentence into various chunks. In markdown, I could just write_italic_and__bold__. I believe no one wants to redad and write something likep(tags$b("living"), "in that", tags$i("row"), "and", tags$b("working"), "in that", tags$i("column"), ". ")Writing list needs to use
tags$ulandtags$li. Again, I am too lazy to type this repeatedly!sometimes writing raw html is required, the way to do this in shiny app is to wrap the text in
HTMLtag. Look at those<span>and<a>tags I wrote inside theHTMLfunction in the end of the first piece of markdown. Which, in turn, is further wrapped by antags$figcaptionfunction! (I know. My eyes also hurts.)tags$figcaption(HTML("<span>Photo by <a href=\"https://unsplash.com/@alisonpang\">Alison Pang</a> on <a href=\"https://unsplash.com/s/photos/hong-kong-bus\">Unsplash</a></span>"), align = "center"),
Using includeMarkdown
After keep revising the paragraphs for a few times, I decided this will be too dumb to write raw HTMLs again and again. Writing raw HTML is a crime against humanity, so as writing raw HTML with R. I thus asked help on Twitter:
Hi #Rstats are there any ways to write paragraphs in a #shiny app with #markdown?
— Kenneth Wong (@Kenneth_KHW) February 9, 2021
Wanna know if there’re any smarter ways than typing dozens of `tags$b`, `tags$i` and `tags$li`… pic.twitter.com/SSck8nMJX8
Luckily Péter Sólymos replied me there’s a htmltools::includeMarkdown() function to render external markdown documents.
I saved each markdown files, from top to bottom, as introduction.md, heatmap.md and sankey.md and put all of them in a folder named description_md. What I have to do is just place them the suitable place in the app.R like this:
...

htmltools::includeMarkdown("description_md/introduction.md"),

...

htmltools::includeMarkdown("description_md/heatmap.md"),

br(),

plotlyOutput("odHeatmap", height = "800px"),

hr(),

htmltools::includeMarkdown("description_md/sankey.md"),

...
Life saver! To me, this is convenient in terms of:
- Separates between text paragraphs and logic in the overall shiny app ui section. I can focus on the ui part (e.g. rendered plot, picker input)
- Easier to revise and proofread the paragraphs