May 06, 2022
Replicating “Zoom to selected features” function in ArcGIS / QGIS with R shiny
Step-by-step guide on recreating "Zoom to selected features" button in shiny, with leaflet and DT
1439 words | 7-min read |
TL;DR
I tried to replicate the “Zoom to selected features” available in ArcGIS / QGIS in Shiny using {DT} and {leaflet}. This post records the steps required to create the button.
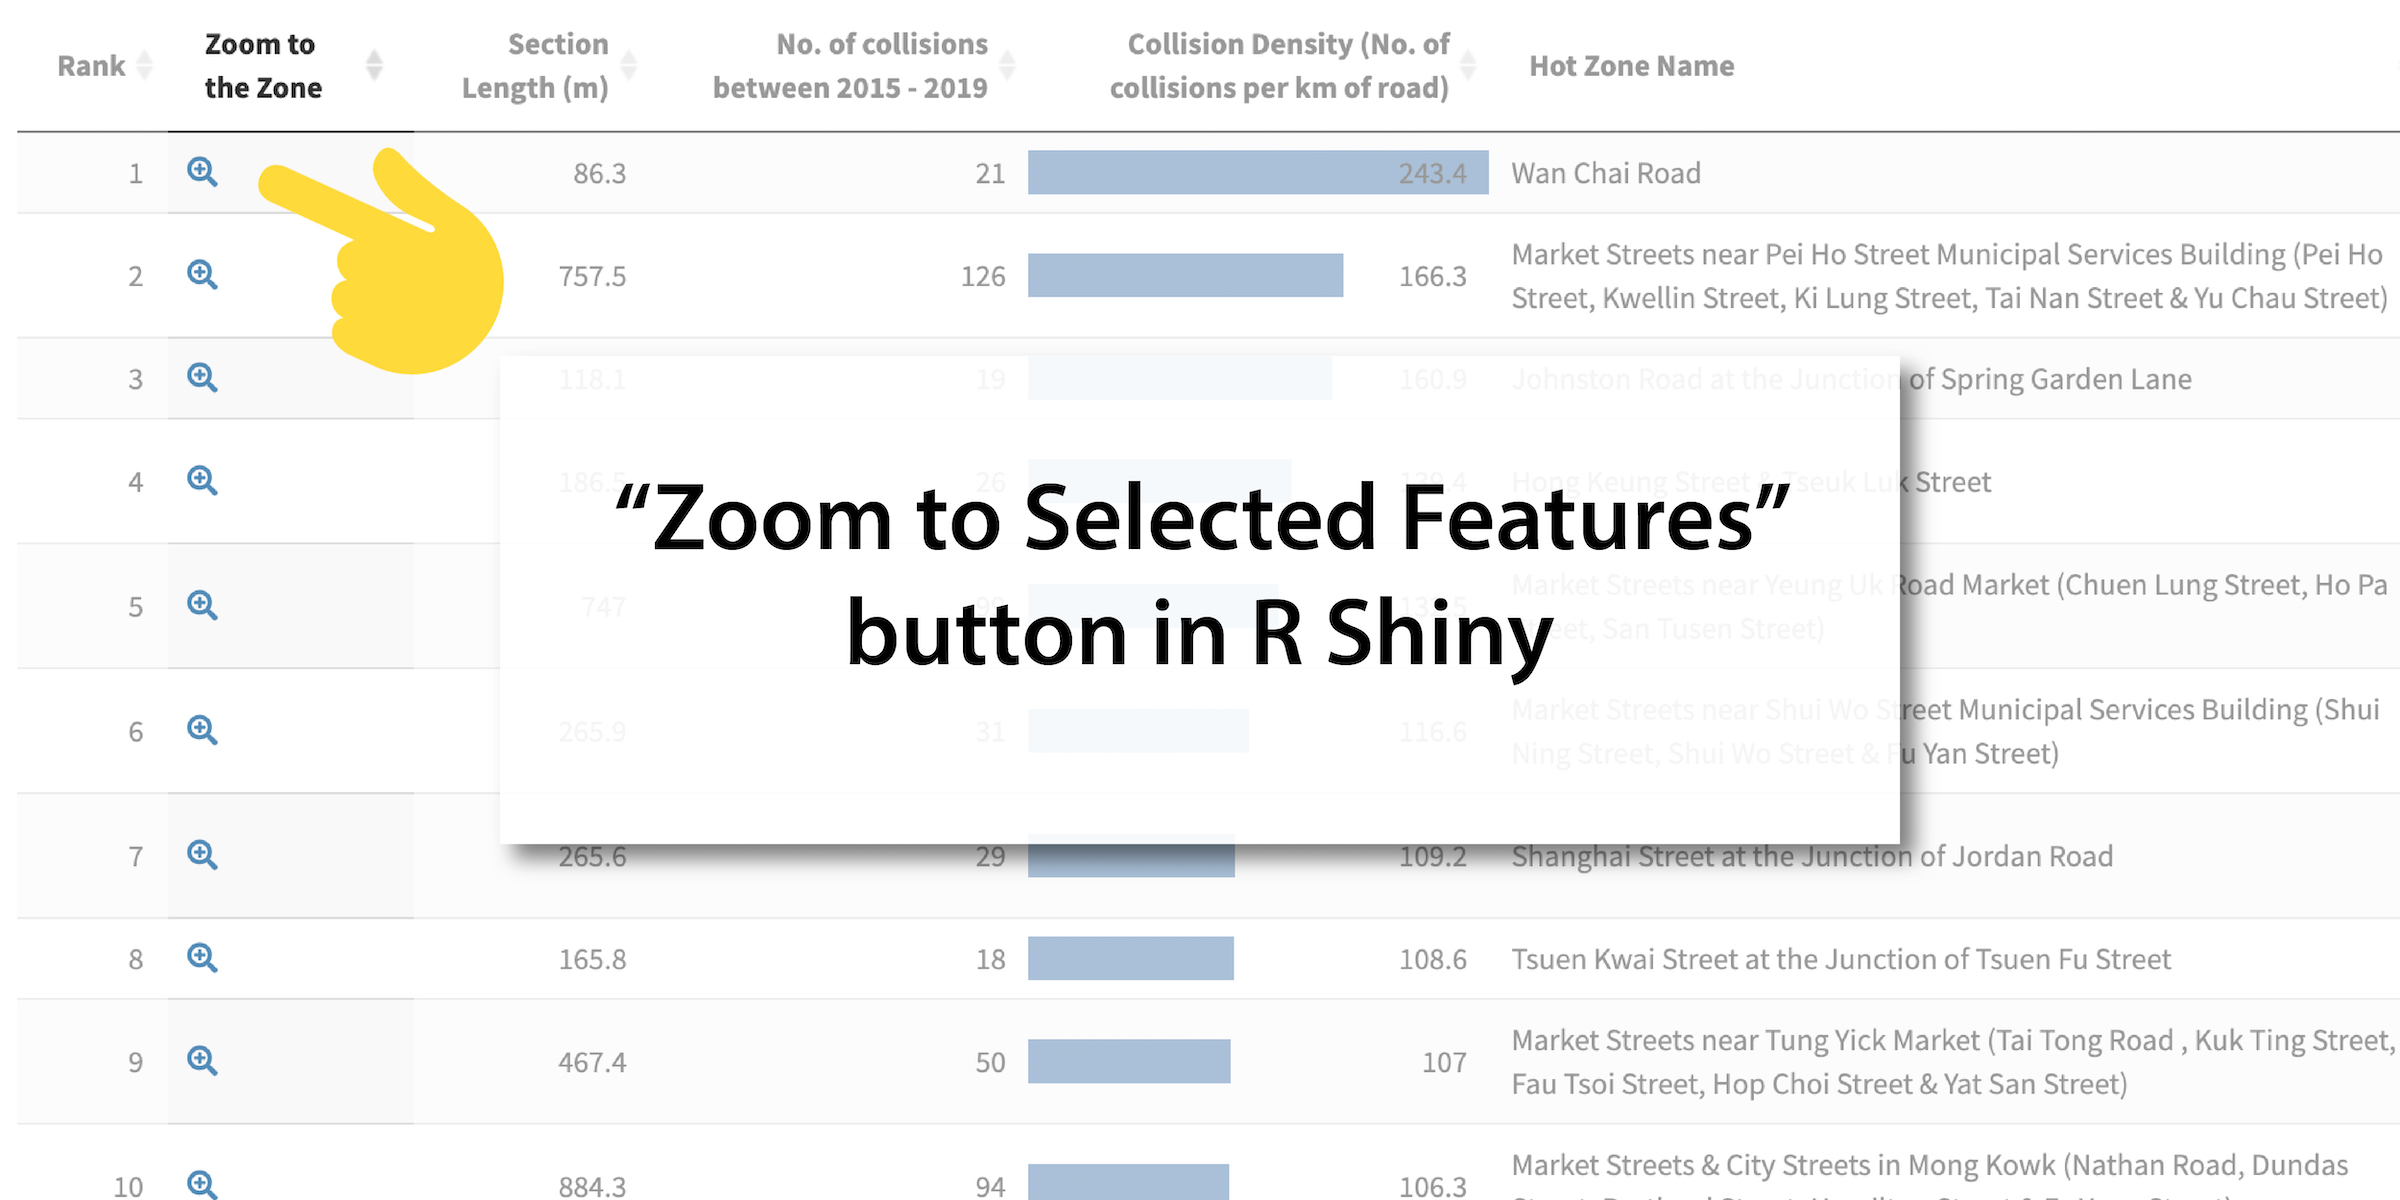
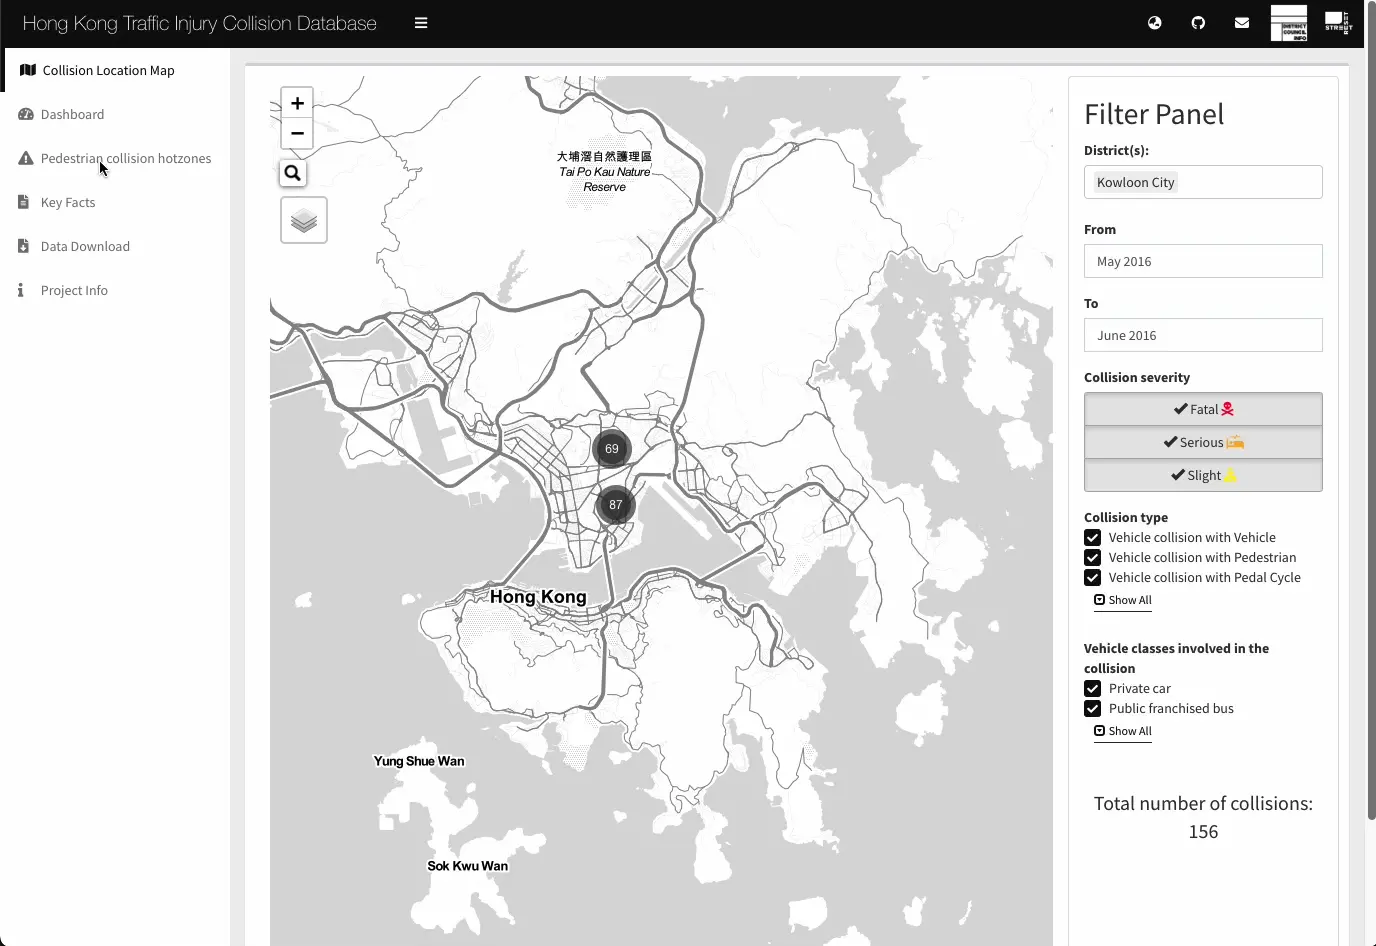
The sample output is available on the Hong Kong Traffic Collision Database website (https://hkdistricts-info.shinyapps.io/trafficcollisions-dev/), under the “pedestrian collision hotzones" section.
Background
With leaflet and DT, when users want to check where a feature is located, they cannot select that row and let the map viewer “zoom to selected features”.
I want to make a “spatial data viewer” in shiny, which is exactly what Desktop GIS does - you have a map viewer on top and an attribute table below, showing the details of each feature (spatial data). We have {leaflet} for creating maps and {DT} for creating interactive tables. Not a big deal when creating the map viewer and attribute table, huh?
There is one major problem though: When users would like to check where that feature is located, they cannot select that row and use the “zoom to selected feature” functionality to make to map viewer zooming to the selected feature.
That’s because the data living inside leaflet map and the data living inside DT table are intrinsically two sets of data which do not “communicate” with each other. When I select a feature (row) on DT, the leaflet map has no idea which feature is selected. This, of course, make us unable to zoom to the selected column.
The {crosstalk} package allows for creating “shared data”, and I have seen examples allowing users to filter the selected featured on the DataTable. Yet, it does not work well for polyline & polygon features (see this GitHub issue for details).
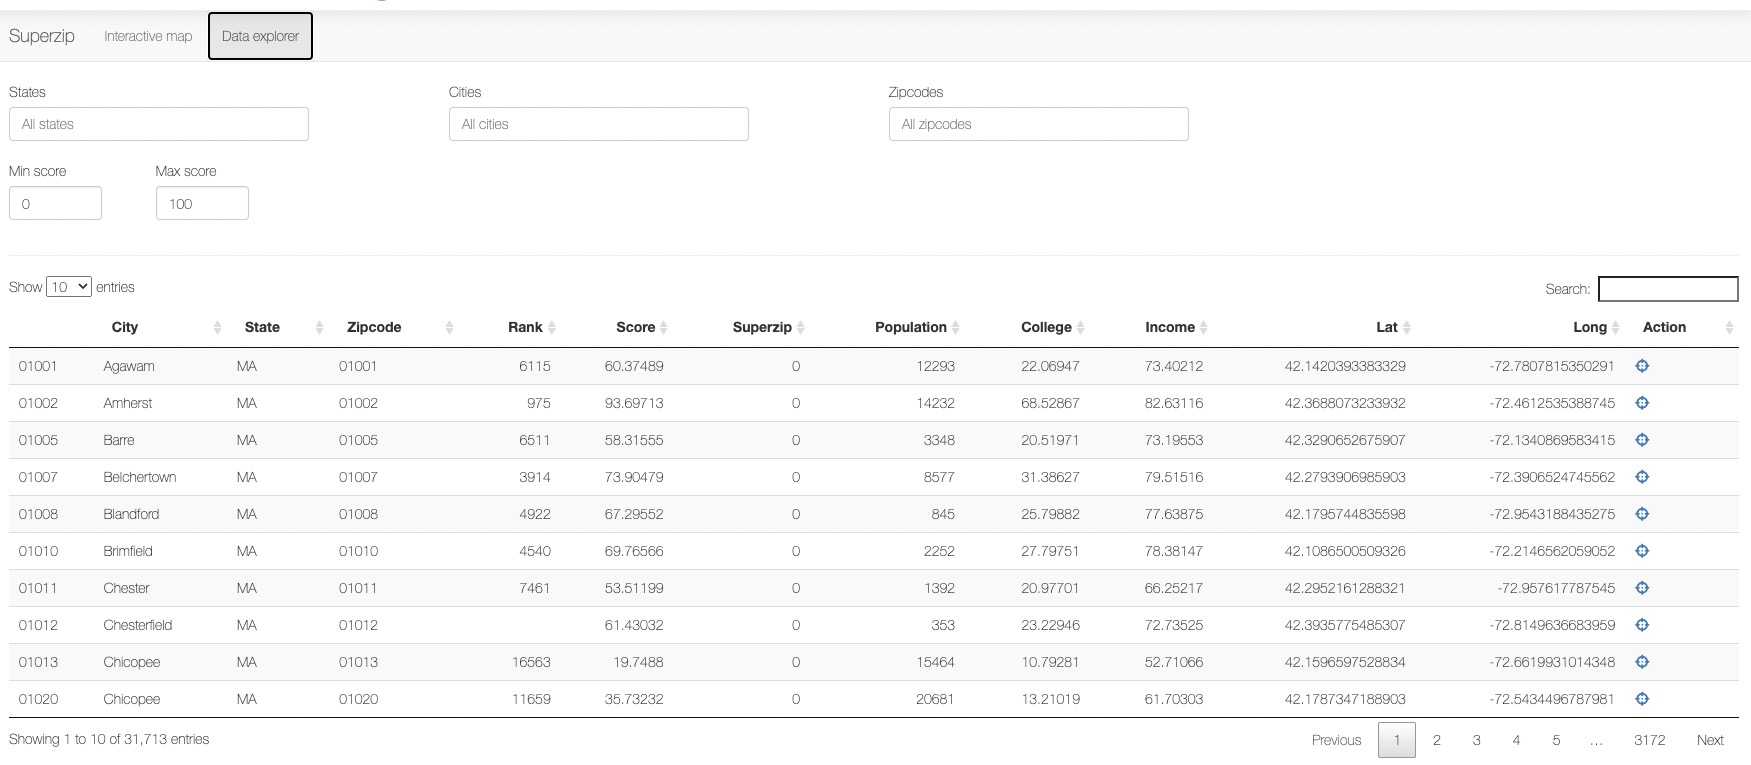
Luckily, I found the SuperZIP shiny demo app (the code lies in GitHub) has done something similar. I stumbled across the code for a few hours before understanding how the heck this function worked. This blog records my understanding of how the code works.
Let’s conceptualise the process first
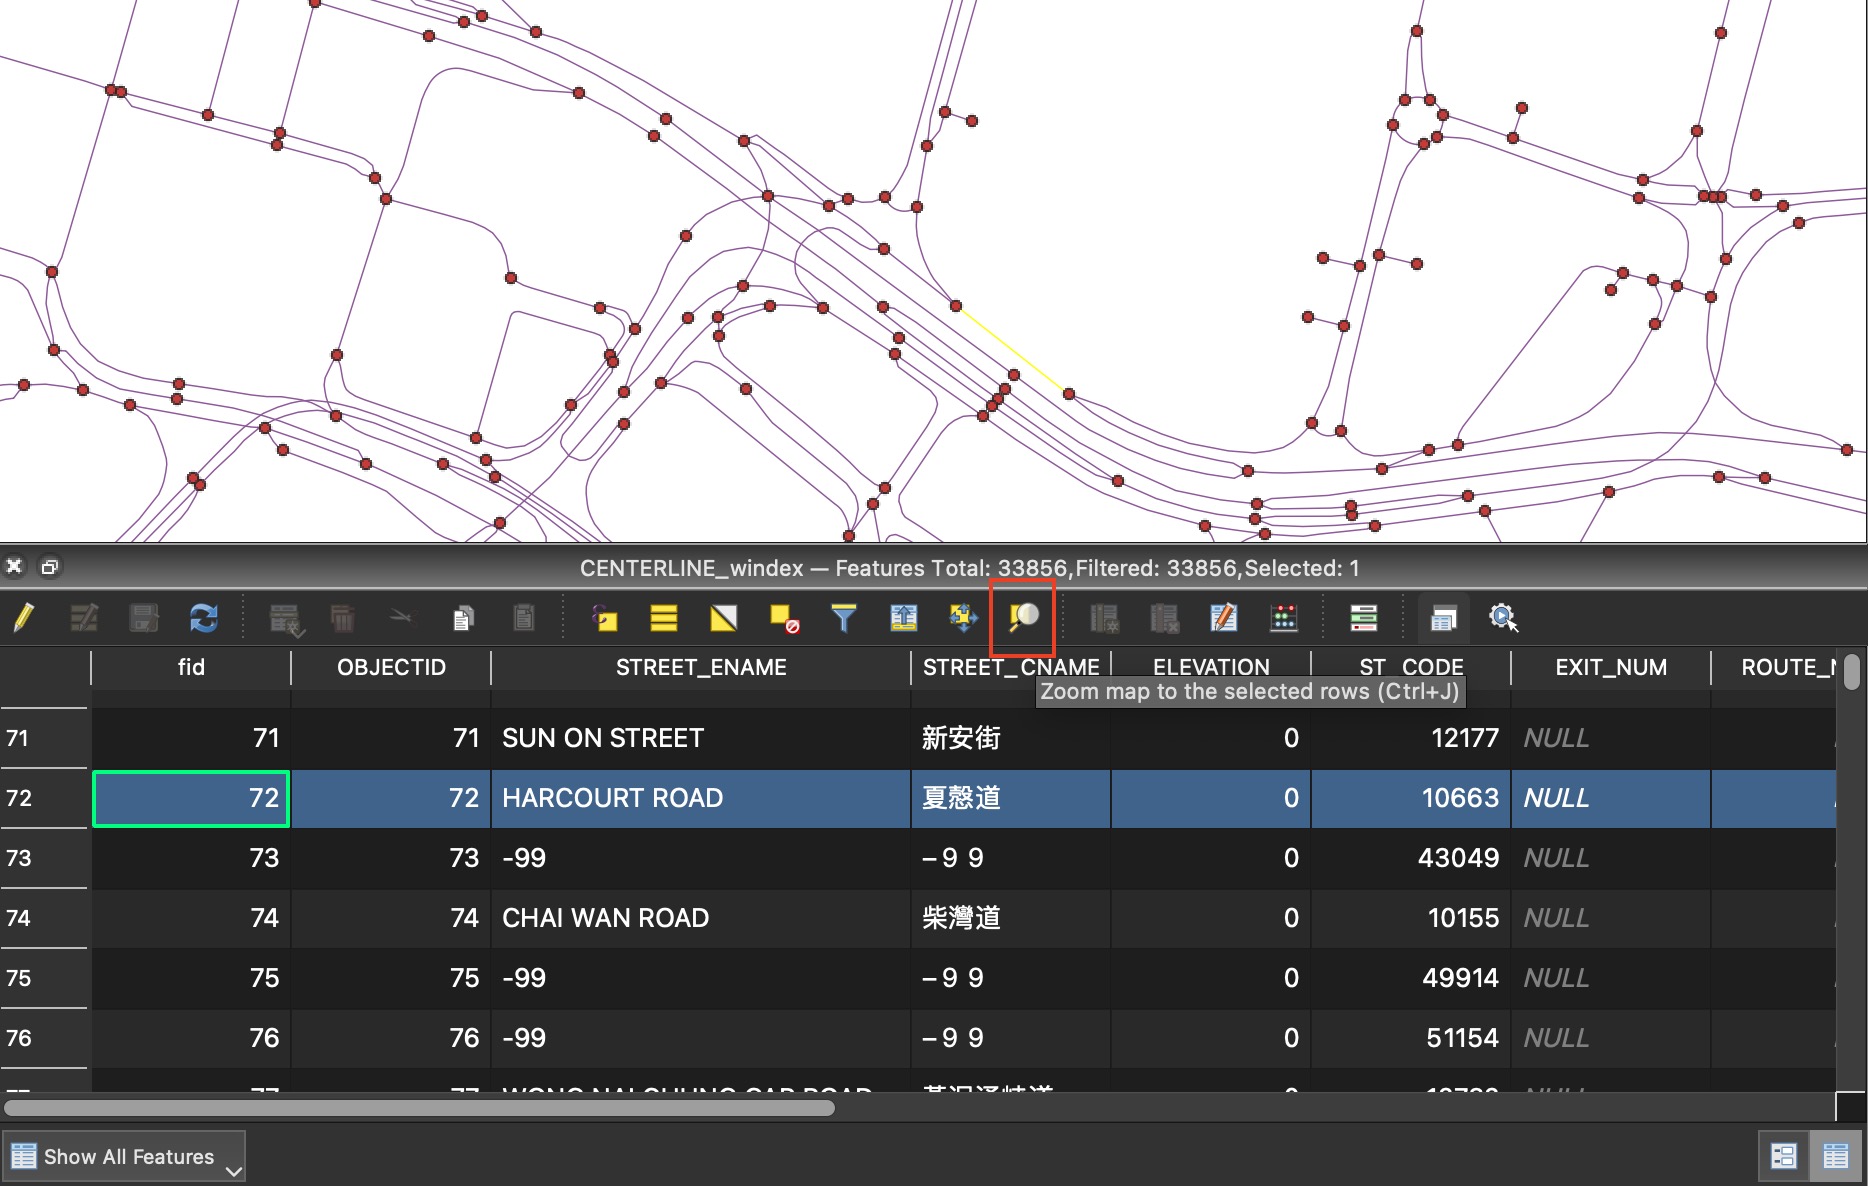
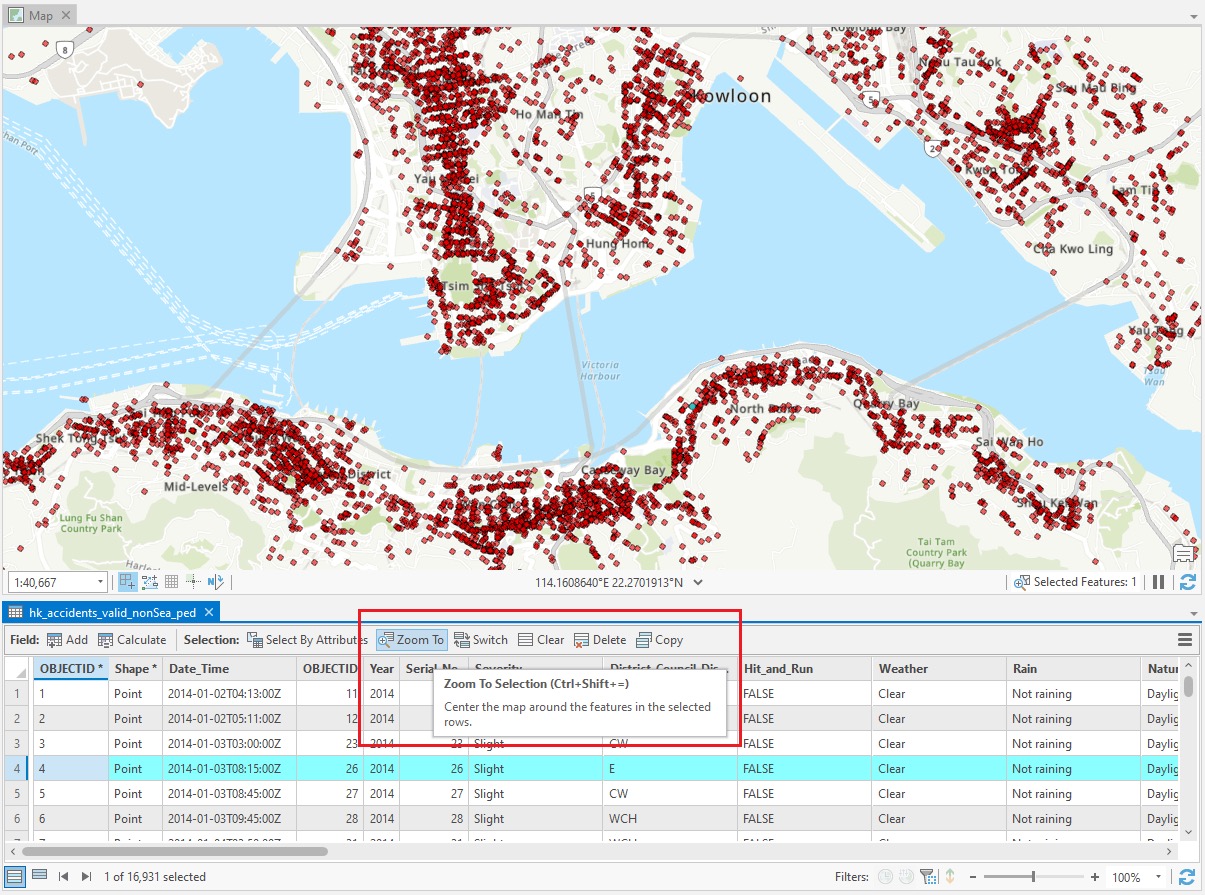
Let’s try to conceptualise what “Zoom to the selected feature” in ArcGIS / QGIS is doing for us first - like, what you and the GUI GIS are doing when you use this function?
- You open an attribute table
- You select a row
- You right-click the selected row, then choose the “Zoom to the selected feature” button
- The map zooms into that row
But does that mean the map and table need to have the same “background data”? No! How about:
- The user clicks on the “zoom to the selected feature”
- The server gets the value of the latitude and longitude (lat & lng) of the selected feature
- Zoom the map to the given set of lat & lng
When the lat & lng are explicitly given, there’s no need to care about the “shared data” state. A bit hacky right? It is, yet no one gives a damn how the things work when the thing actually works.
The Steps
Step I: Add new columns to the dataset
There are two things required to transform the spatial data (named as SF_DATA below) before adding the zoom-in functionality:
- Project the feature to CRS of WGS84 (4326). The coordinates have to be in lat & lng degree for the leaflet web maps (which uses lat and lng to locate views) to understand.
- If the feature is line or polygon, transform it to point. For line,
st_centroidworks. For polygons,st_point_on_surfacehelps create a cartographic center point which lies inside the polygon.
After that, we create two columns, lat and lng to store the latitude and longitude of the centroid of the feature class. The next tricky thing is creating an HTML hyperlink tag column (zoom_in_map_link). This will allow us to play some JavaScript tricks inside the Shiny app.
OUTPUT_DF = SF_DATA %>%
  st_centroid() %>%
  st_transform(crs = st_crs(4326)) %>%
  mutate(lng = sf::st_coordinates(.)[,1], lat = sf::st_coordinates(.)[,2]) %>%
  # create the required data zooming into the feature with gomap.js
  mutate(zoom_in_map_link =
           paste('<a class="go-map" href=""',
                 'data-lat="', lat, '" data-lng="', lng,
                 '"><i class="fas fa-search-plus"></i></a>',
                 sep="")
         )
When you check the edited (mutate in the sense of {dplyr}), dataframe, the zoom_in_map_link stores some HTML tags like below:
<a class="go-map" href="" data-lat="22.2770663564959" data-lng="114.176989030987">
  <i class="fas fa-search-plus"></i>
</a>
Each cell is a hyperlink tag <a> shown as a fontawesome icon <i>. Special things lie inside the attributes of the <a> tag. The go-map class is used for the JavaScript recognise this is the “Zoom to the selected feature” button. And the data-lat and data-lng HTML attributes will be used to transport the data to JavaScript.
Step II: Set up AJAX URL request in datatable
In the output DataTable (which should be inside renderDataTable function), we need to set up an AJAX request URL for each row. This is achieved using the dataTableAjax function and adding the options = list(ajax = list(url = action)) argument inside datatable function.
In addition, for datatable to render the HTML tags as HTML element rather then verbatim text (i.e. the fontawesome icon instead of <i class="fas fa-search-plus"></i>), we need to add the escape = FALSE argument.
output$OUTPUT_TABLE = renderDataTable({

  # `rownames` needs to be consistent with `DT::datatable` option
  action = DT::dataTableAjax(session, OUTPUT_DF, rownames = FALSE)

  datatable(
    OUTPUT_DF,
    rownames = FALSE,
    options = list(ajax = list(url = action)),
    # Render HTML tags inside table (e.g. fontawesome icons in <i> tags)
    escape = FALSE
    )
})
At this step, when you click on the button, the website will be redirected back to the index page (or home page of the shiny app). That’s because we have not set the action to do (i.e. URL link) that href attribute is still blank. By default, a blank href value will return the user to the index page of the website.
Step III: Set up JS and include it in R
The next thing is to play with JavaScript. Create a new JS file and name it gomap.js. Then, add the following:
// Zoom to the specified location on a leaflet map in shiny
// adapted from https://github.com/rstudio/shiny-examples/blob/main/063-superzip-example/gomap.js

// When locator icon in datatable is clicked, go to that spot on the map
$(document).on("click", ".go-map", function(e) {
  e.preventDefault();
  $el = $(this);
  var lat = $el.data("lat");
  var lng = $el.data("lng");
  // $($("#nav a")[0]).tab("show");
  Shiny.onInputChange("goto", {
    lat: lat,
    lng: lng,
    nonce: Math.random()
  });
});
On the top level, this JS script is just:
- Get the HTML tag of that row
- Get the lat & lng attributes of this HTML tag
- Write the lat & lng value into the
inputobject of Shiny
The Shiny.onInputChange function set up a new value goto in the server’s input object (check the Communicating with Shiny via JavaScript guide in Shiny official website for details of Shiny.onInputChange!). The goto value includes the lat and lng of that row (which is included inside the <a> tag, with the attributes of data-lat and data-lng). The nonce is merely a cryptographic nonce for debugging use.
Then, add this JS file into Shiny. Otherwise, shiny has no idea that you wanna include this JS file when running the app! Add this line of code inside the R scripts storing the UI code (ui.R in my case).
includeScript("gomap.js")
Step IV: Set up reactive observer
Now the input object in the Shiny server contains the goto value which stores the lat & lng value of the feature we would like to zoom into. Let’s utilise it in the app by creating a reactive observer.
observe({
  # escape initialise state
  if (is.null(input$goto)) return()

  isolate({
    map = leafletProxy("OUTPUT_MAP")

    lat = input$goto$lat
    lng = input$goto$lng

    setView(map, lng, lat, zoom = 17)
  })
})
The code is explicit here:
When the input object in Shiny Server does NOT have the value of goto:
- Do nothing.
When input$goto exists:
- Create a proxy to the leaflet map we would like to control.
leafletProxyallows us to send commands to the map. - Get the lat & lng from the
gotoobject, which itself is an object insideinput - Use the lat & lng value to set the view extent of the map with
setView
And there you have it: we have replicated the “Zoom to Selected Feature” function in R Shiny.
Closing murmurs
Again, I have successfully reinvented the GUI GIS wheel. In the end, this is just a coding challenge for me to understand more how shiny works. And the more I code, paradoxically more I impress how Desktop GIS saves time for laymen like me to perform some tasks that we deemed “fundamental”.