January 31, 2022
Create custom tile layer in Mapbox and use it in R
How to convert spatial data to map tiles and avoid rendering 15k points in leaflet
1649 words | 7-min read |
TL;DR
I have a task of showing ~15,000 points on an interactive map, and decided to create a map tile to show the points on map. This blog jots down the steps of how I tried to 1. create a custom style of the points with Mapbox, 2. publish the style as Web Map Tile Service (WMTS) and TileLayer for leaflet and 3. Add the tiles to R (with leaflet or tmap packages).
Background
How to effectively show many points for solely indicative purposes in an interactive map?
The team of Hong Kong Districts Info (I am one of the members) has been developing a dashboard of the historical database of traffic collisions in Hong Kong using R (all source codes are publicly available in GitHub!). The latest task is to develop the “hotzone streets” section, which will be an interactive map showing 1. streets sections with high pedestrian-related traffic accidents density, as well as 2. ALL locations of pedestrian-related traffic accidents. The later one is a spatial dataset containing around 15,000 points.
With that much points, rendering the points as symbols is properly the worst approach - leaflet draws the symbols one by one (to my understanding), and drawing ~15,000 icons is not a trivial task. When I tested on my M1 mac, it takes >10 seconds to initialise the map! The large memory pressure harms the performance so much.
Therefore, I need to find alternative ways to effectively show the points to minimise loading time and save computing power.
The points in this case are merely used for indicating the locations. The purpose of these points are same as basemaps, which is to indicate geographic locations. Icons and symbols are appropriate if the points needs to be interactive - like the symbols changes when you hover on it, or popup showing attributes appears when user clicks on the points. Interactive symbols are, therefore, not the approach needed.
My task finally becomes convert the points to a tile basemap. Basemaps are intrinsically map tiles, thus the question need to handle is:
How could I 1. create a tile layer of a point layer and 2. add it to leaflet?
After some trial and errors, I found using Mapbox tiles is currently (to my understanding) the most convenient solution.
Steps
Step 1: Upload data to Mapbox
Login to Mapbox and go to the Mapbox Studio. Then click the Datasets tab on the top right corner, then click New dataset button.

Then, directly drag the dataset in the window appeared, Mapbox will upload it automatically!
NOTE: Mapbox only accepts certain types of spatial data file formats. In my case, the point data in my computer is originally in .gpkg. I converted it to GeoJSON with ogr2ogr first before uploading it Mapbox.

Step 2: Create style
Create new blank Style
The next thing is to create a new Style. I got confused at first, yet seems it is possible to create TileLayers using either Style or Tileset in Mapbox.

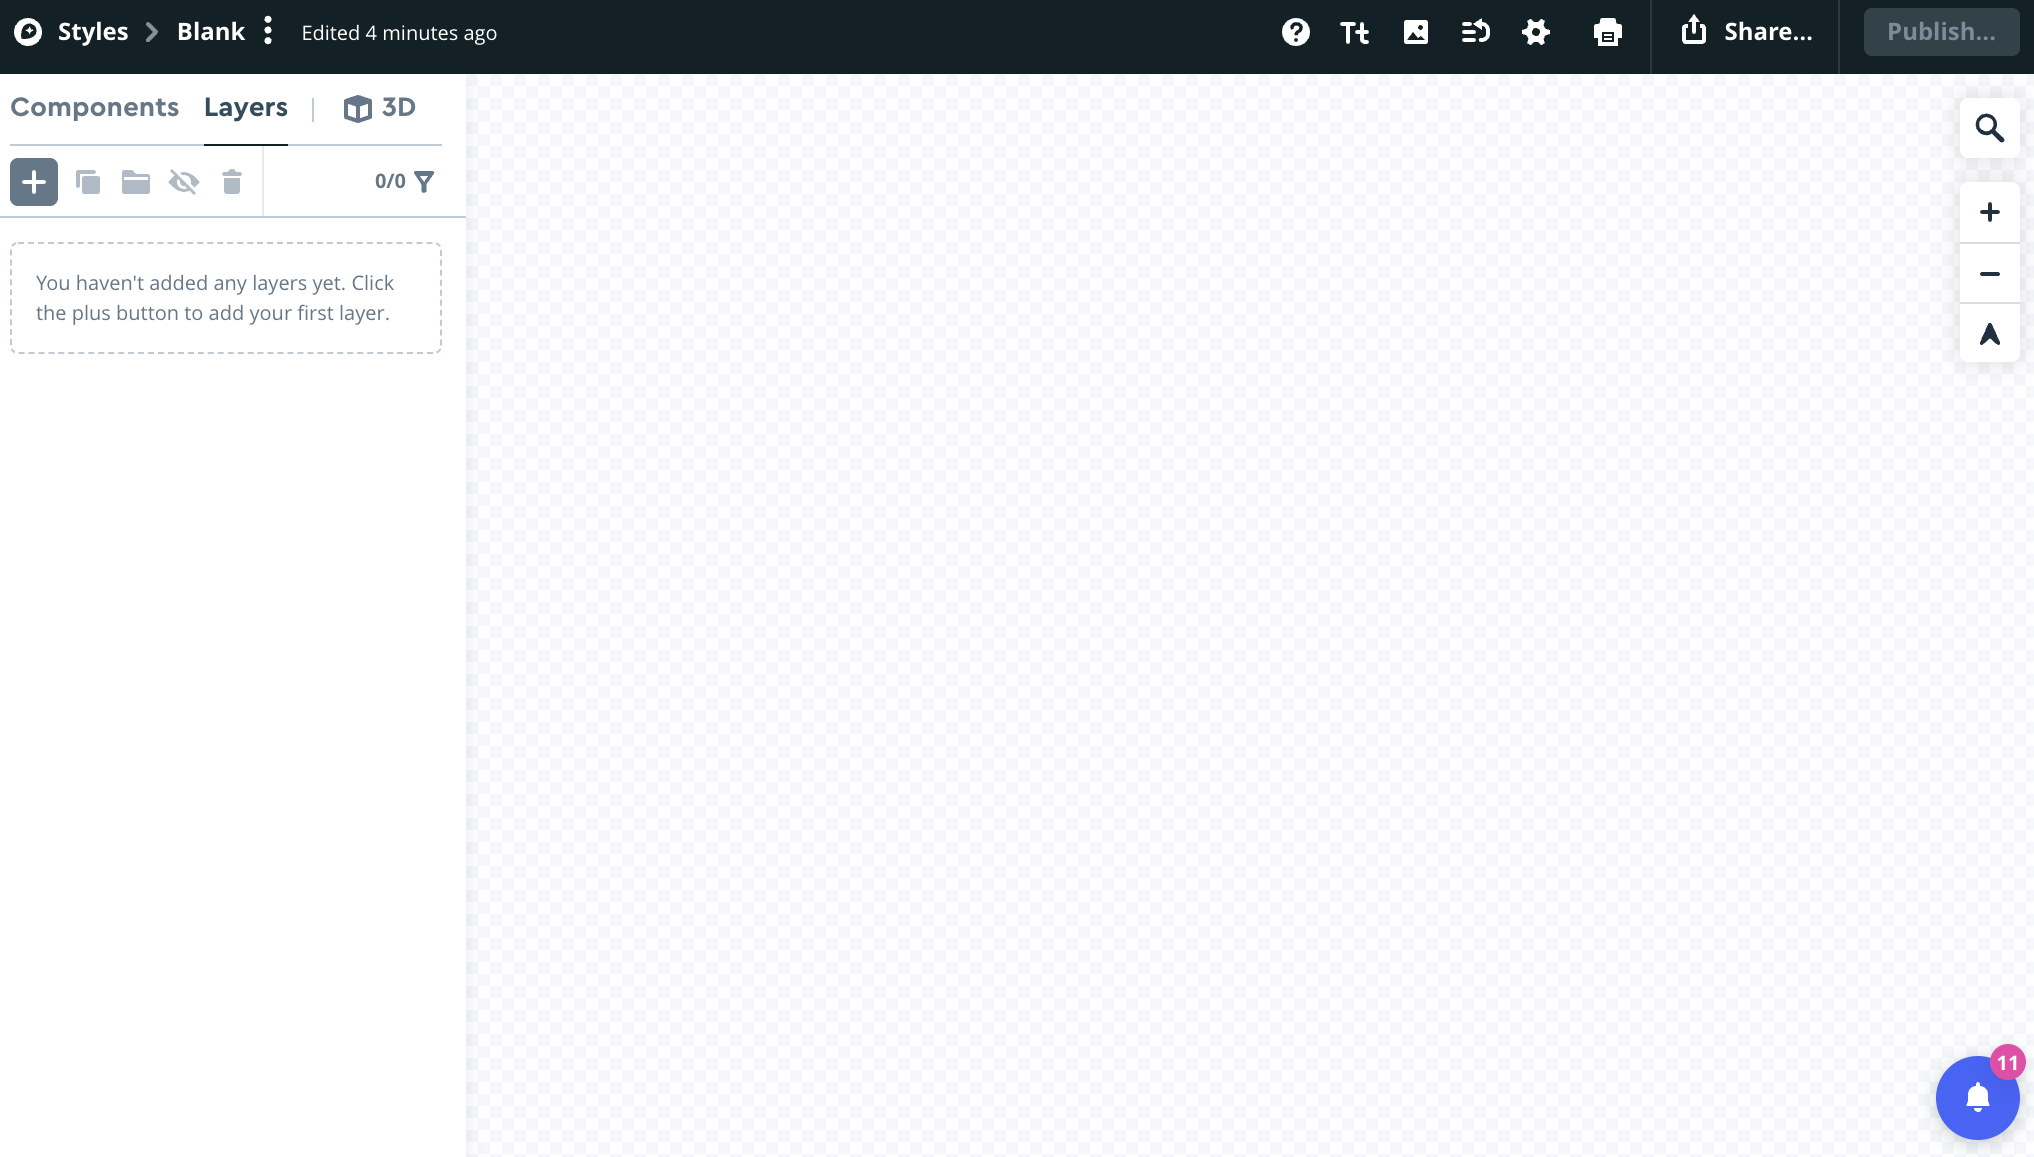
Then scroll to the bottom and select Blank (The tile does not need any other features, since this additional layer of mostly-transparent tiles will overlay the existing basemap only when there are points above!). Then click on the Customize Blank button.

Add data to the style
With the Blank style, we have - a transparent canvas of null.
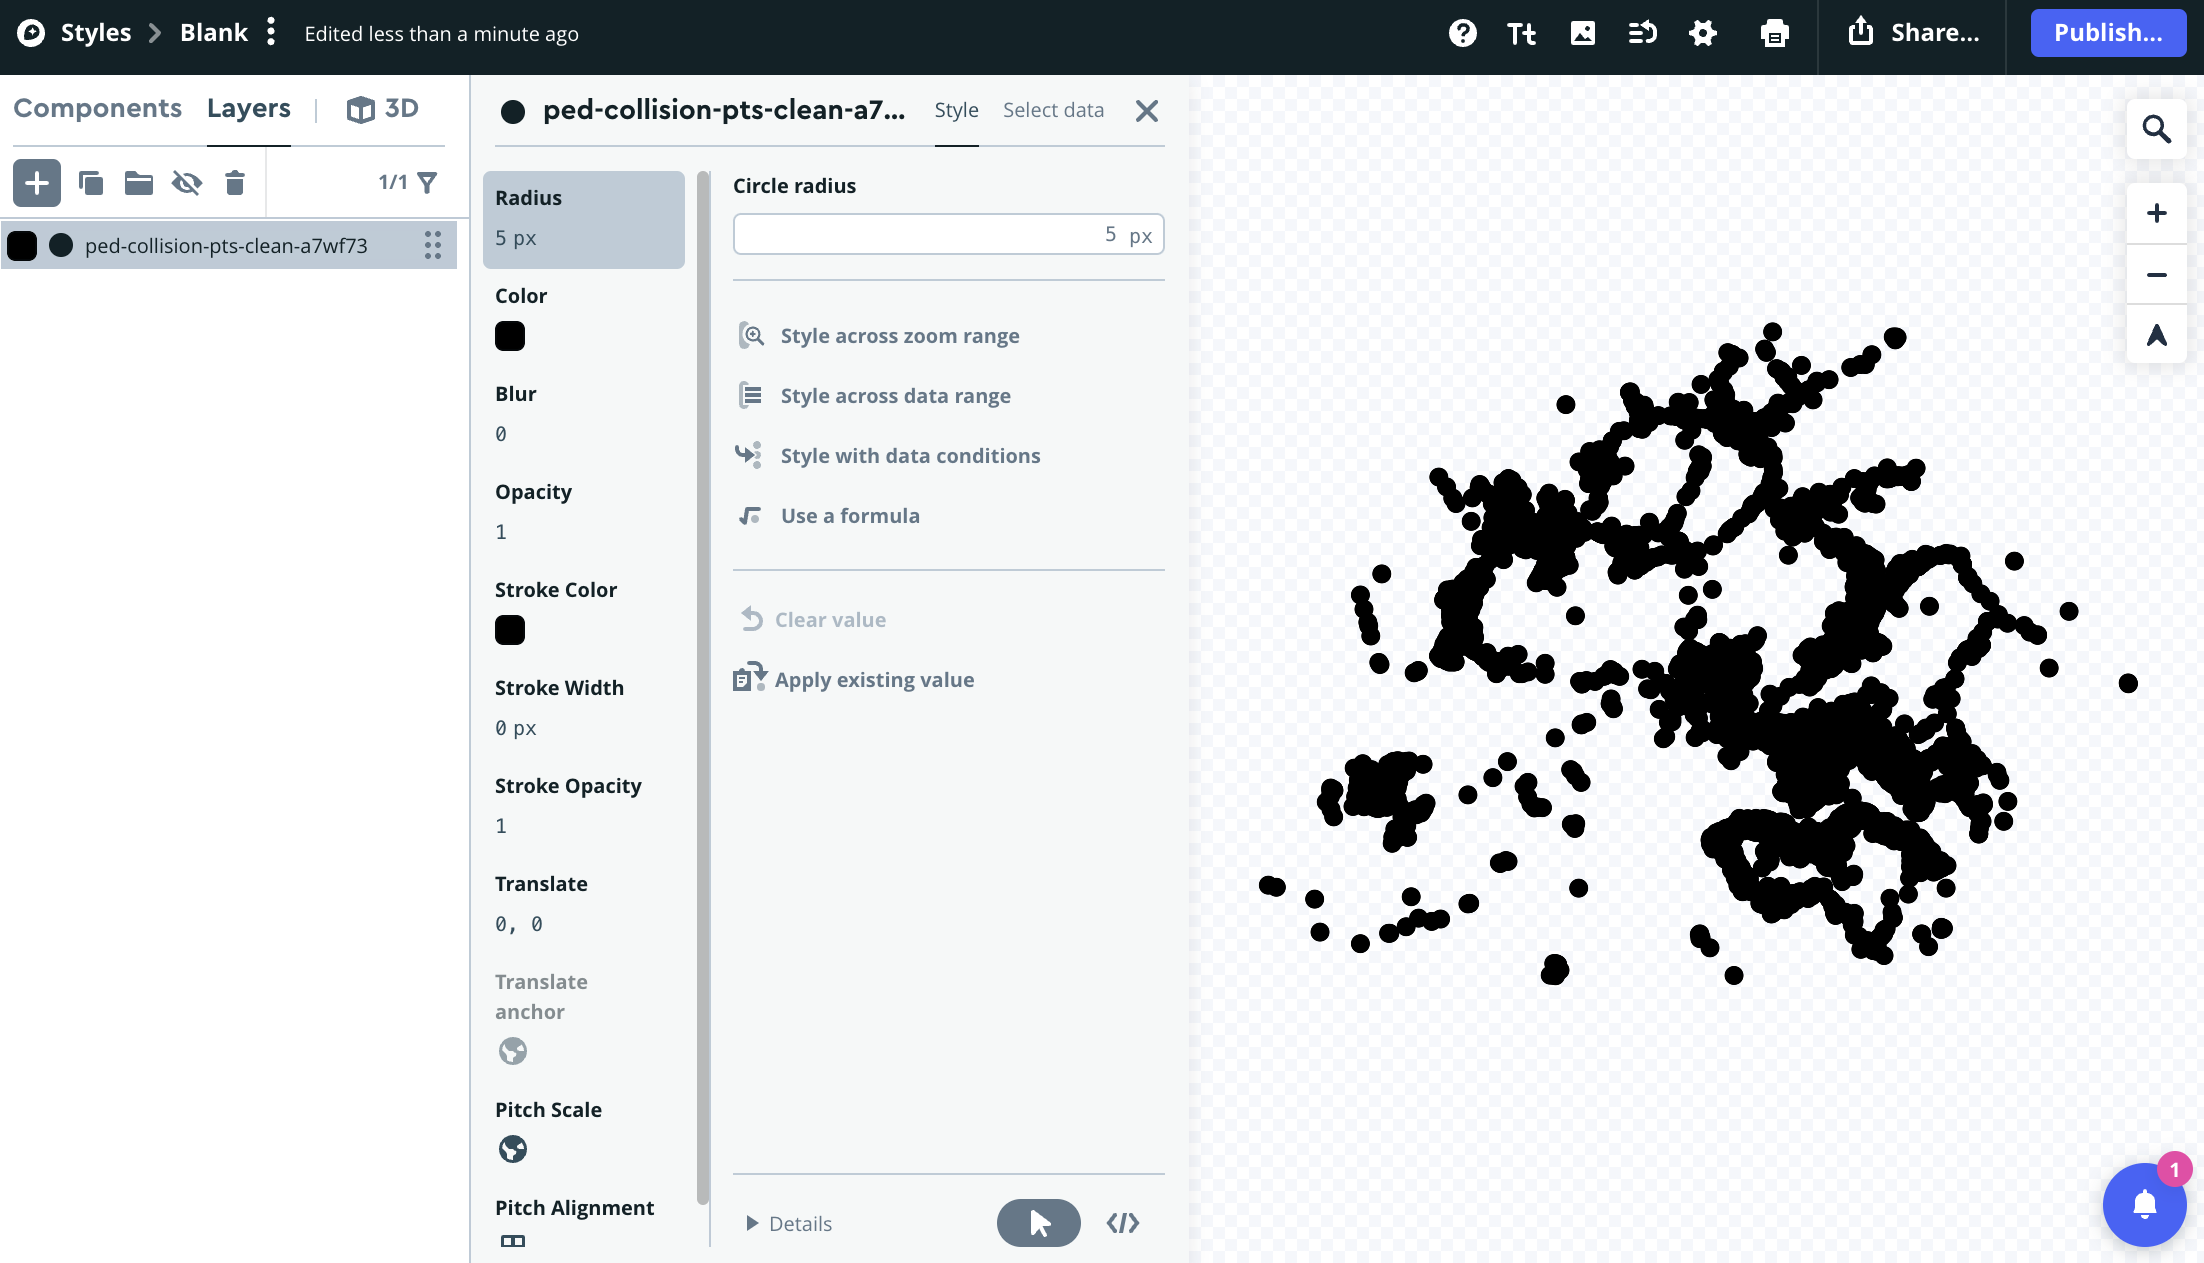
Of course that’s not what’s needed. We need to have the points shown! Add the data to the current style by clicking on the Layers tab, then the add icon, select the point data just uploaded (in my case, ped_collision_pt) as the Source.
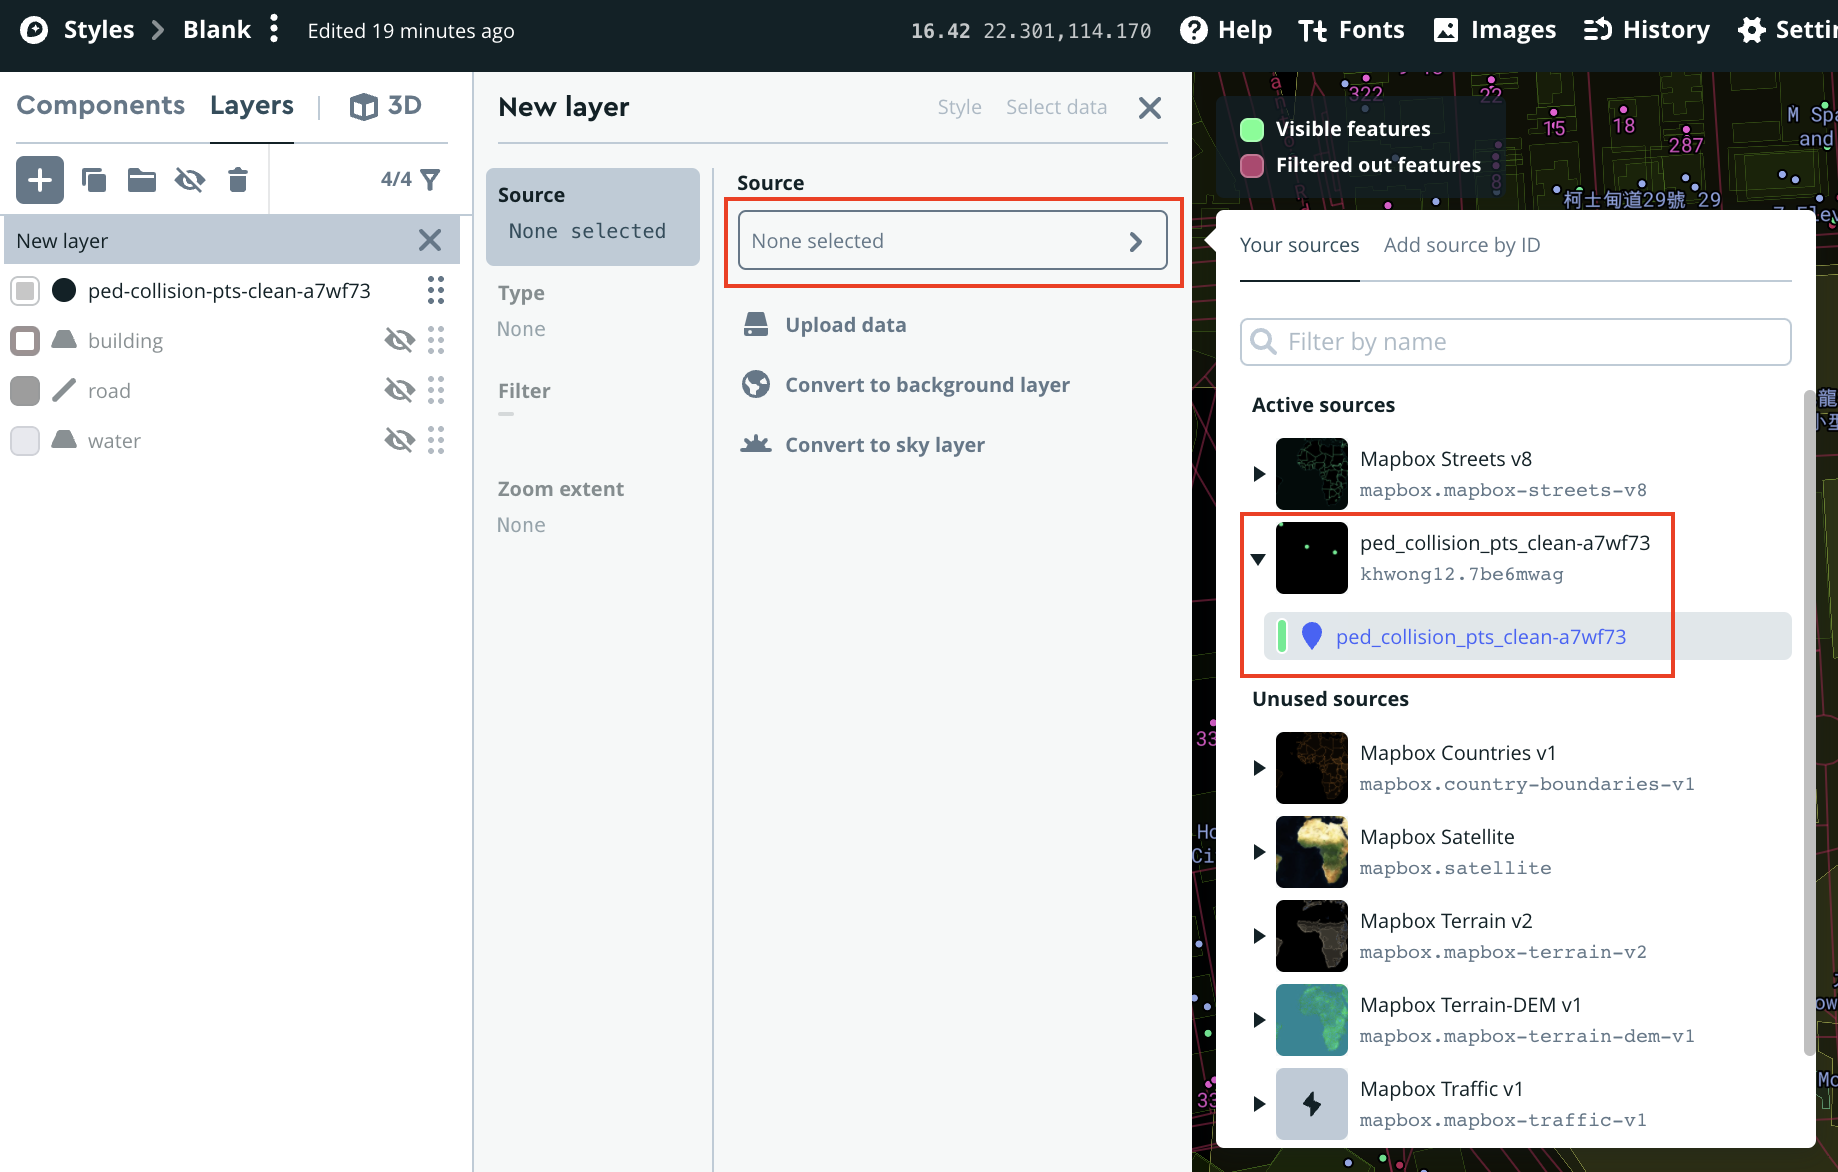
The points should then pops out on the map canvas.
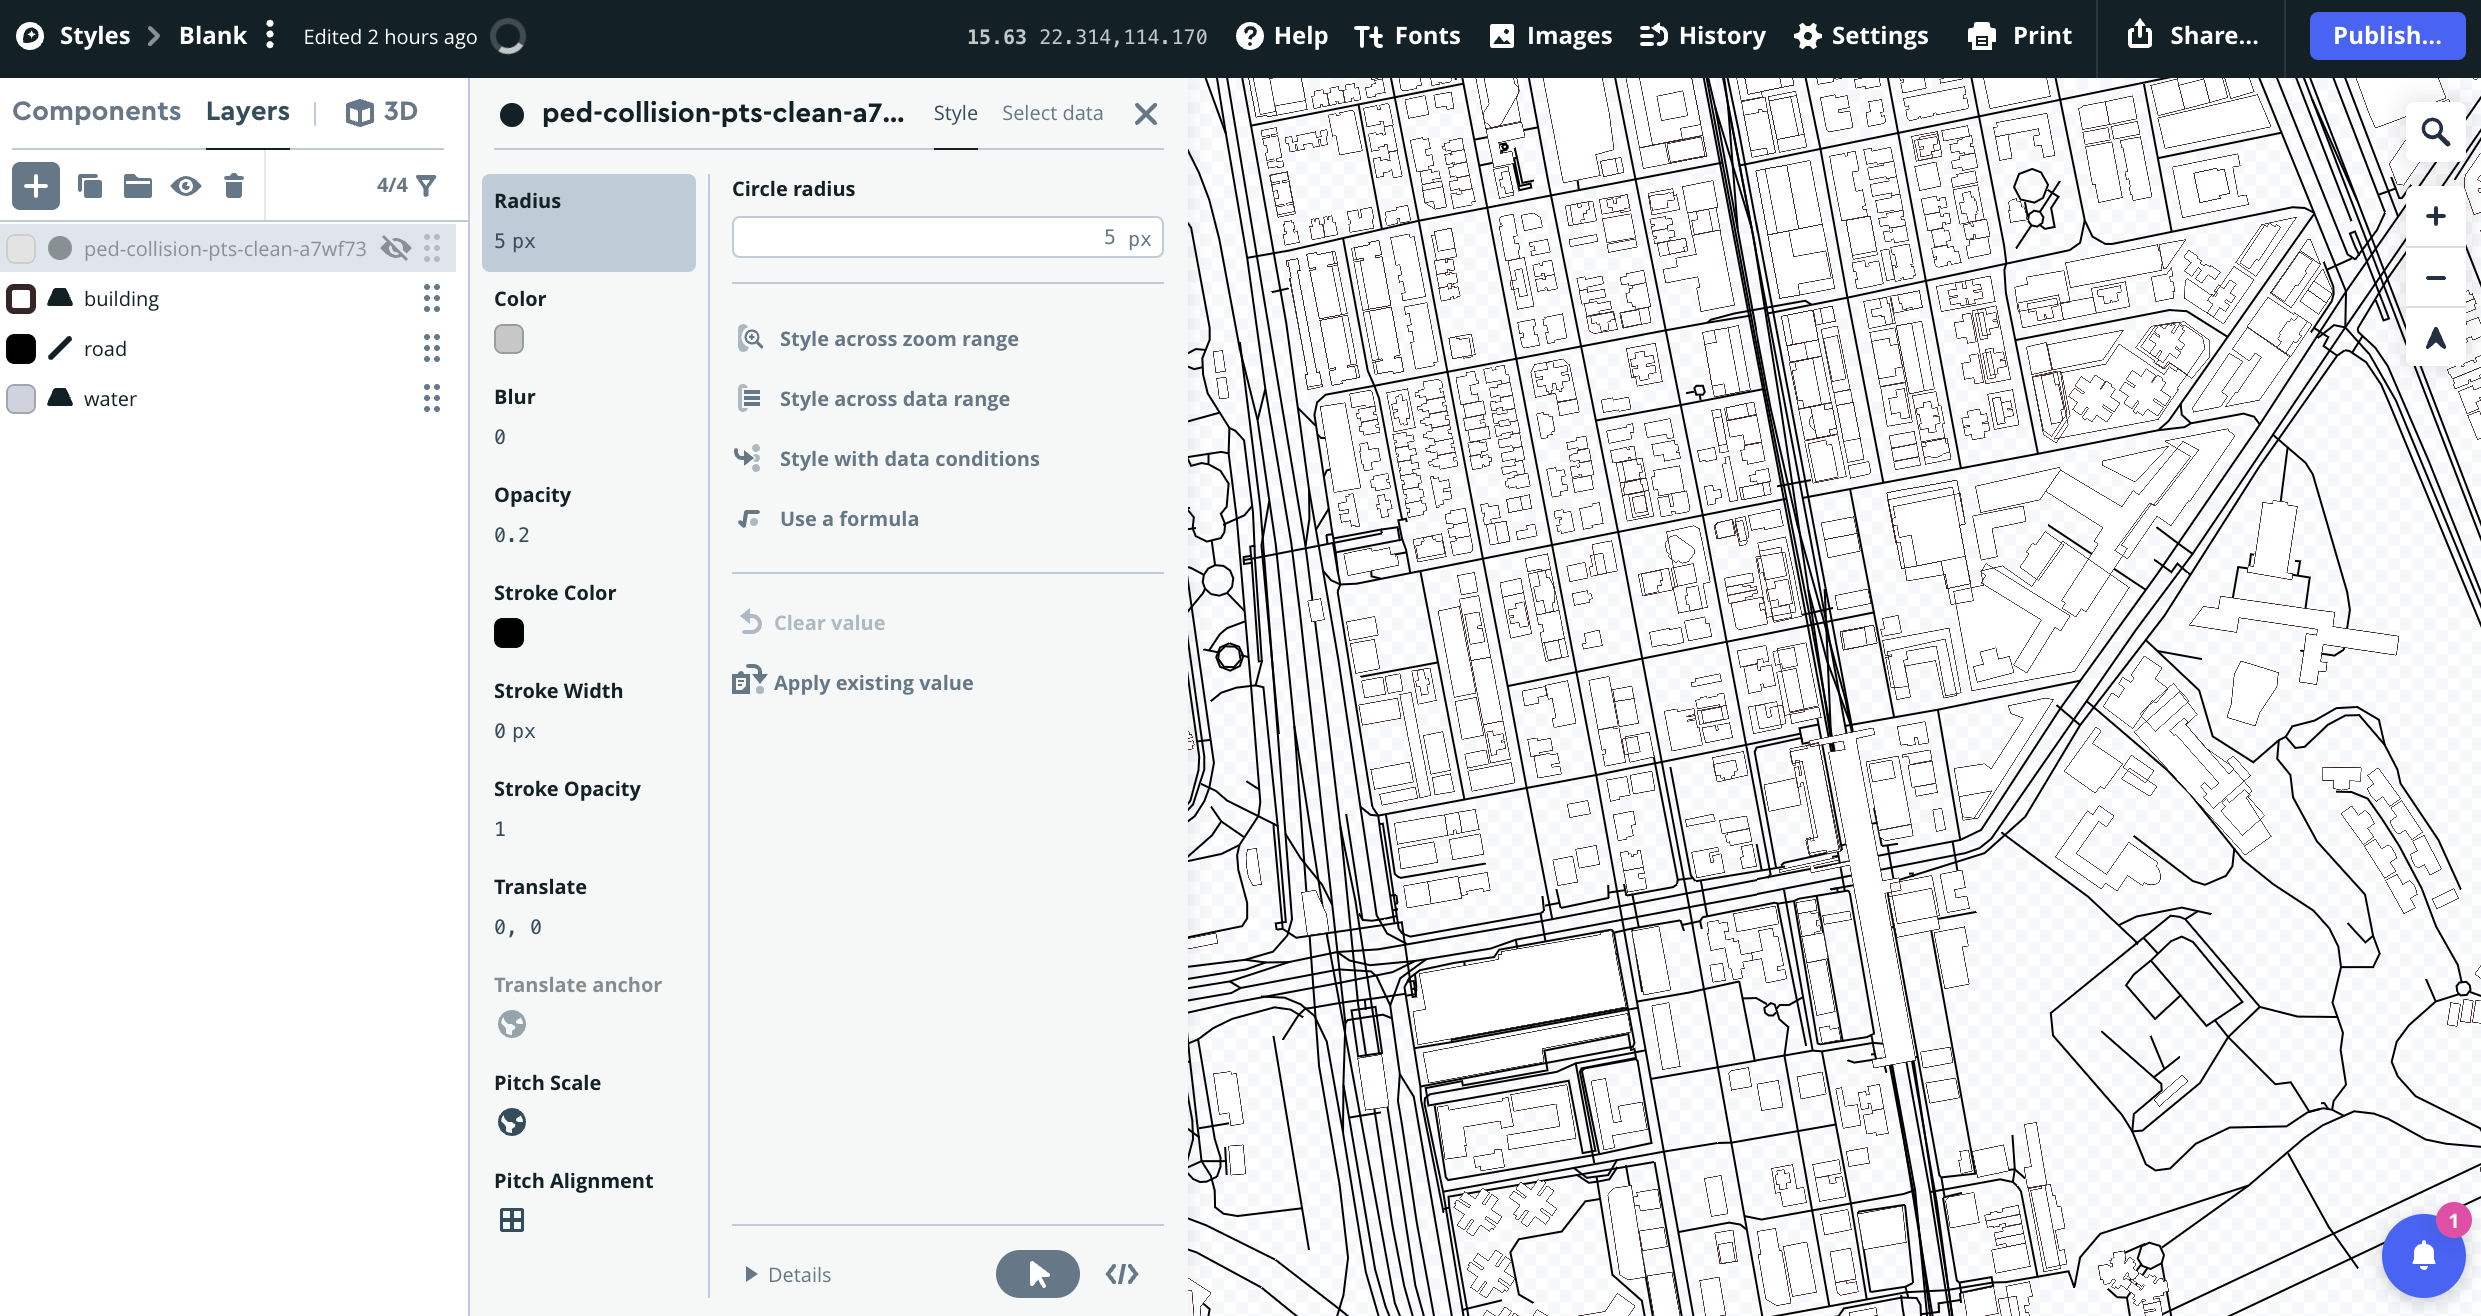
Add reference layers
To simulate how the points will look like when added to my existing basemap (Stamen Tonerlite), I also add the building , road and water layer from the Mapbox Streets basemap template.
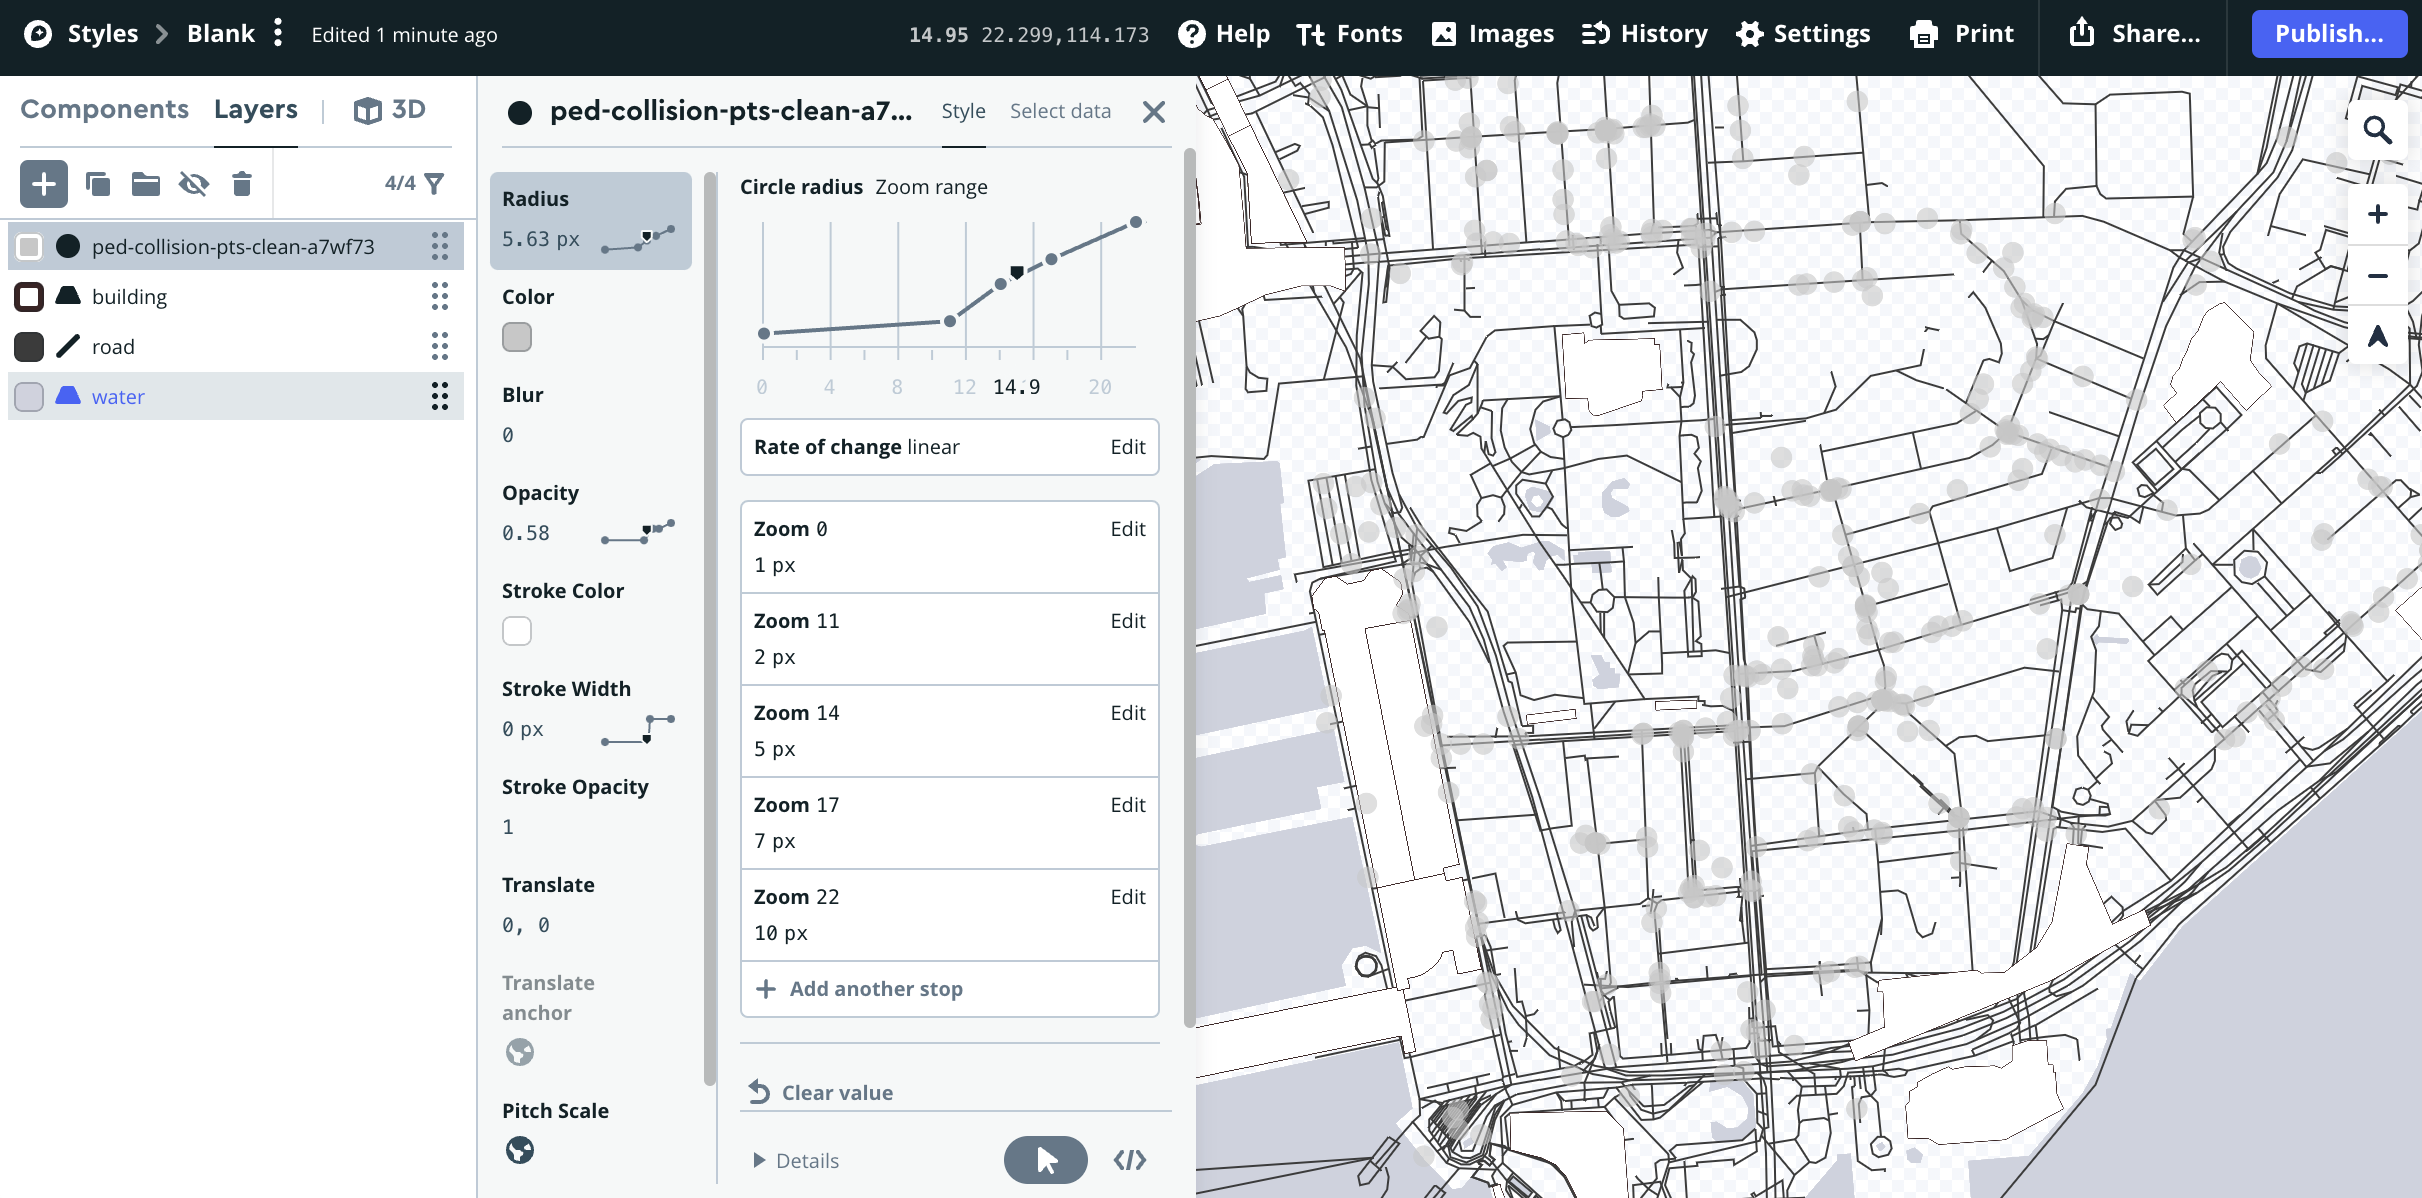
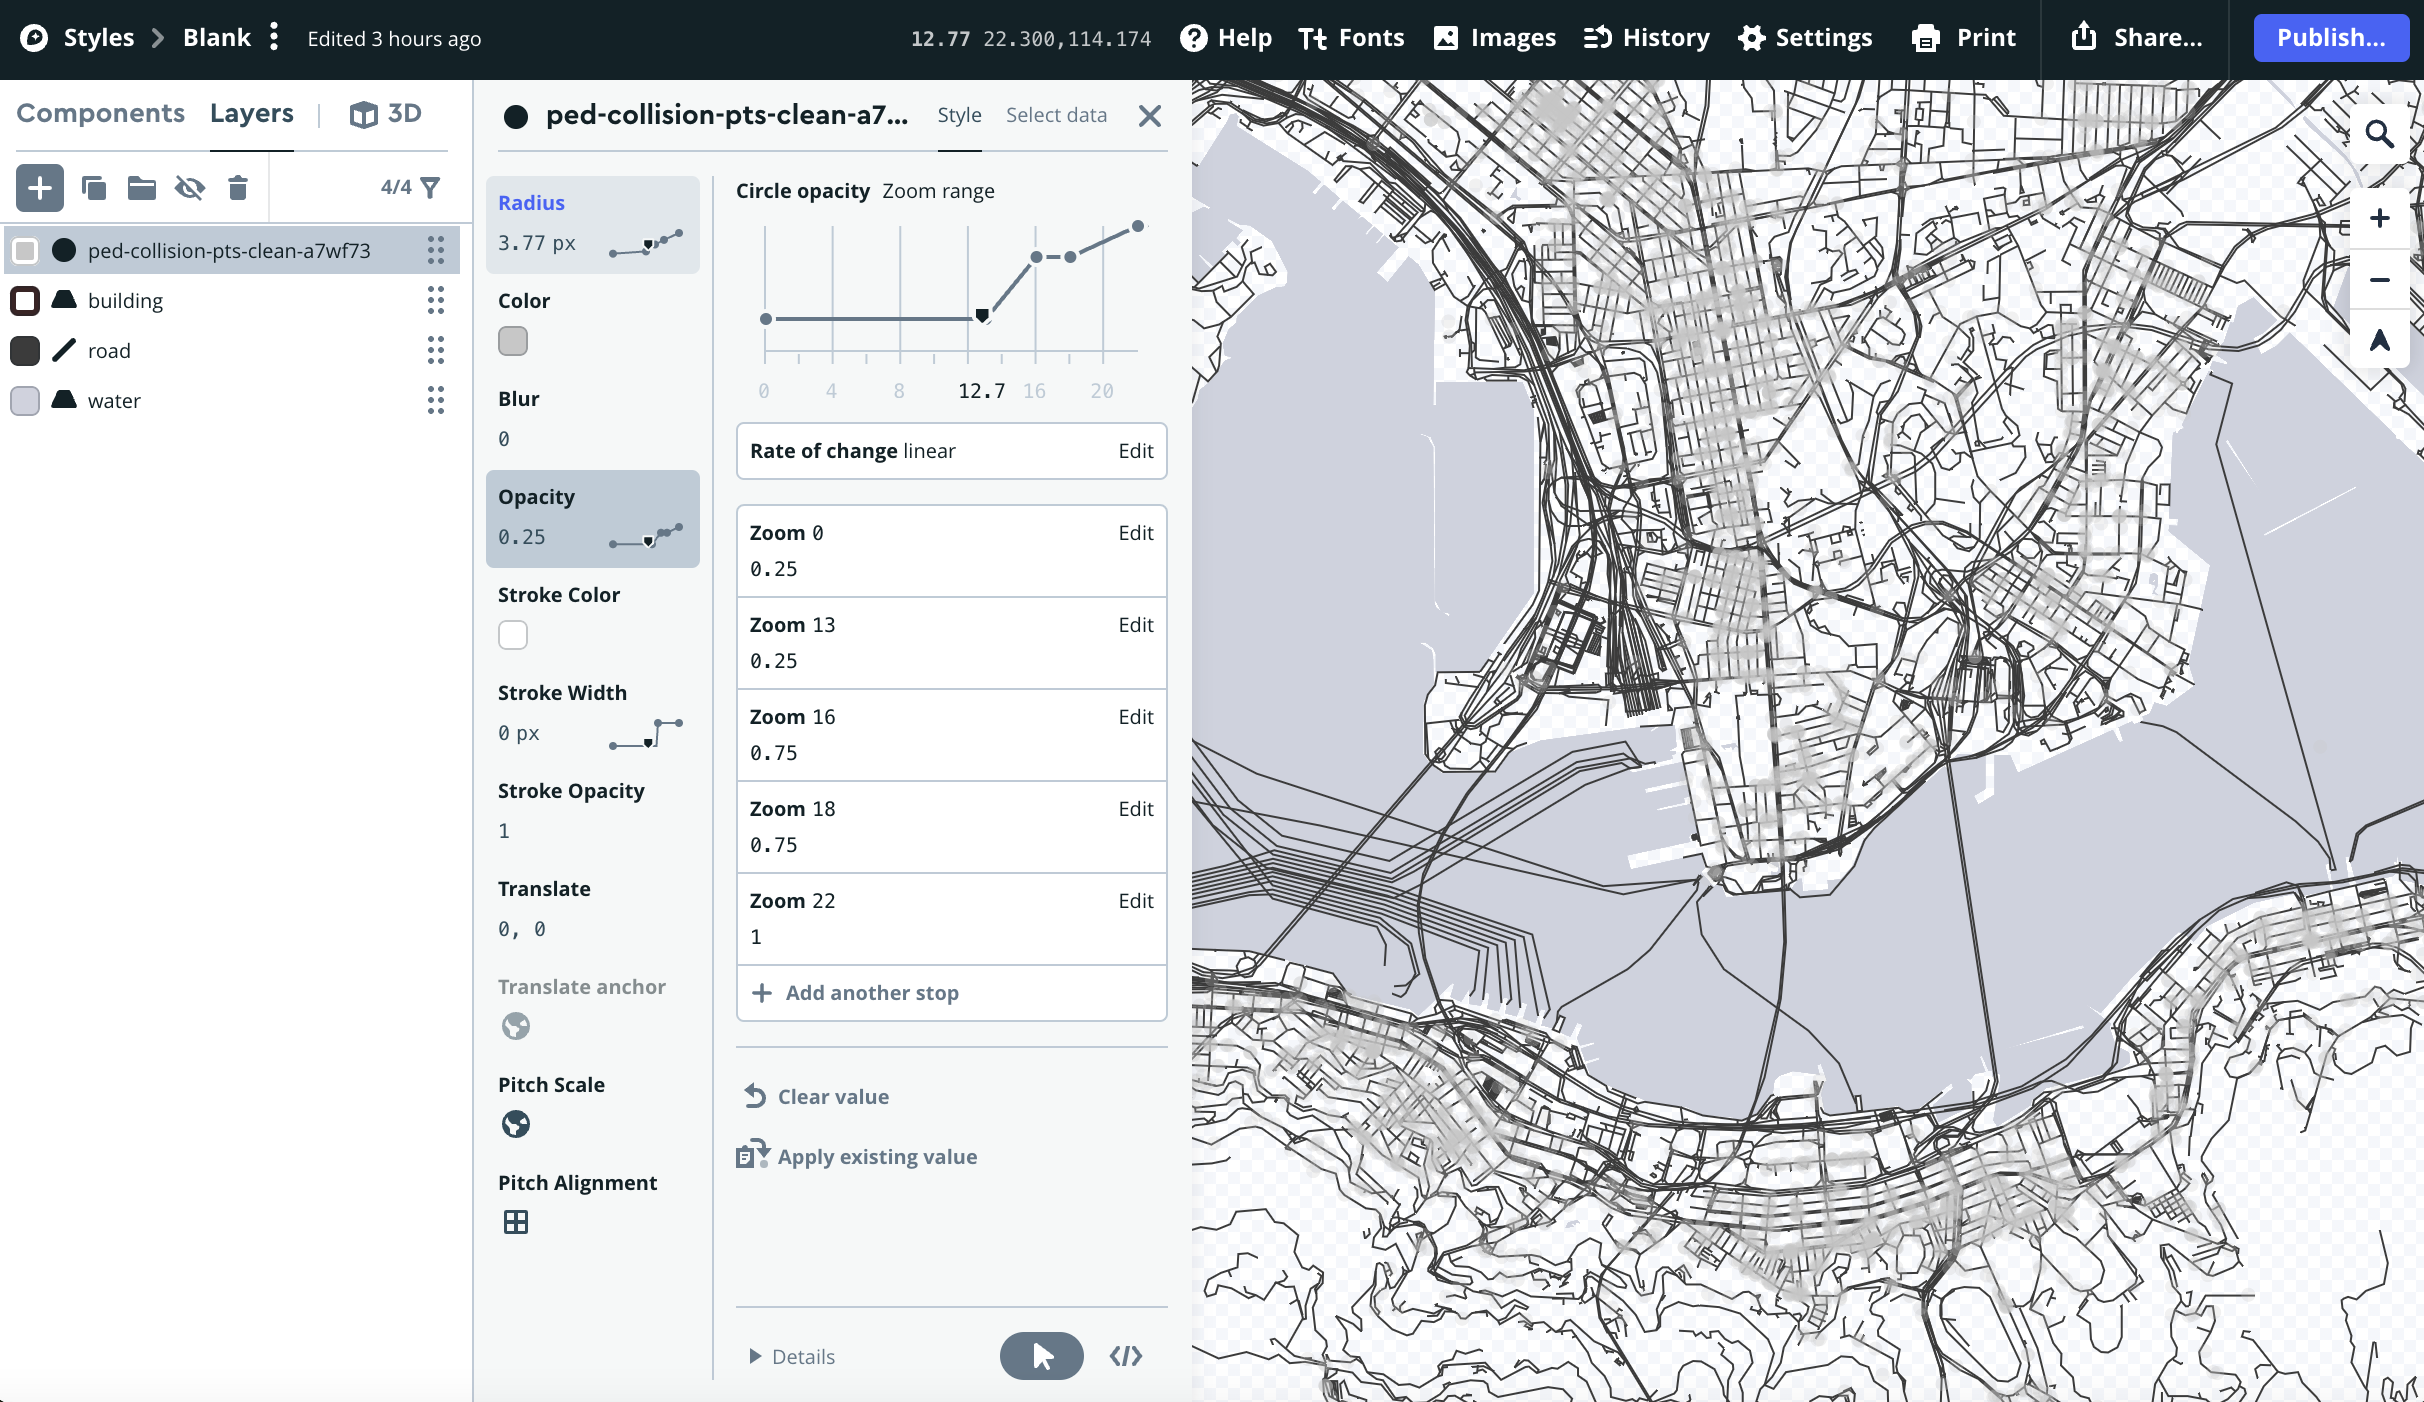
Adjust appearances of points
Next thing is to twerk the appearances (symbology in the sense of ArcGIS/QGIS) to simulate the basemap. As the Tonerlite basemap is intrinsically a B&W canvas, so I set a similar one on the Mapbox style canvas within 3 mins. (Remember we will only export the point layer appearances to the final tile. Those additional layers are merely for reference for development purposes.)
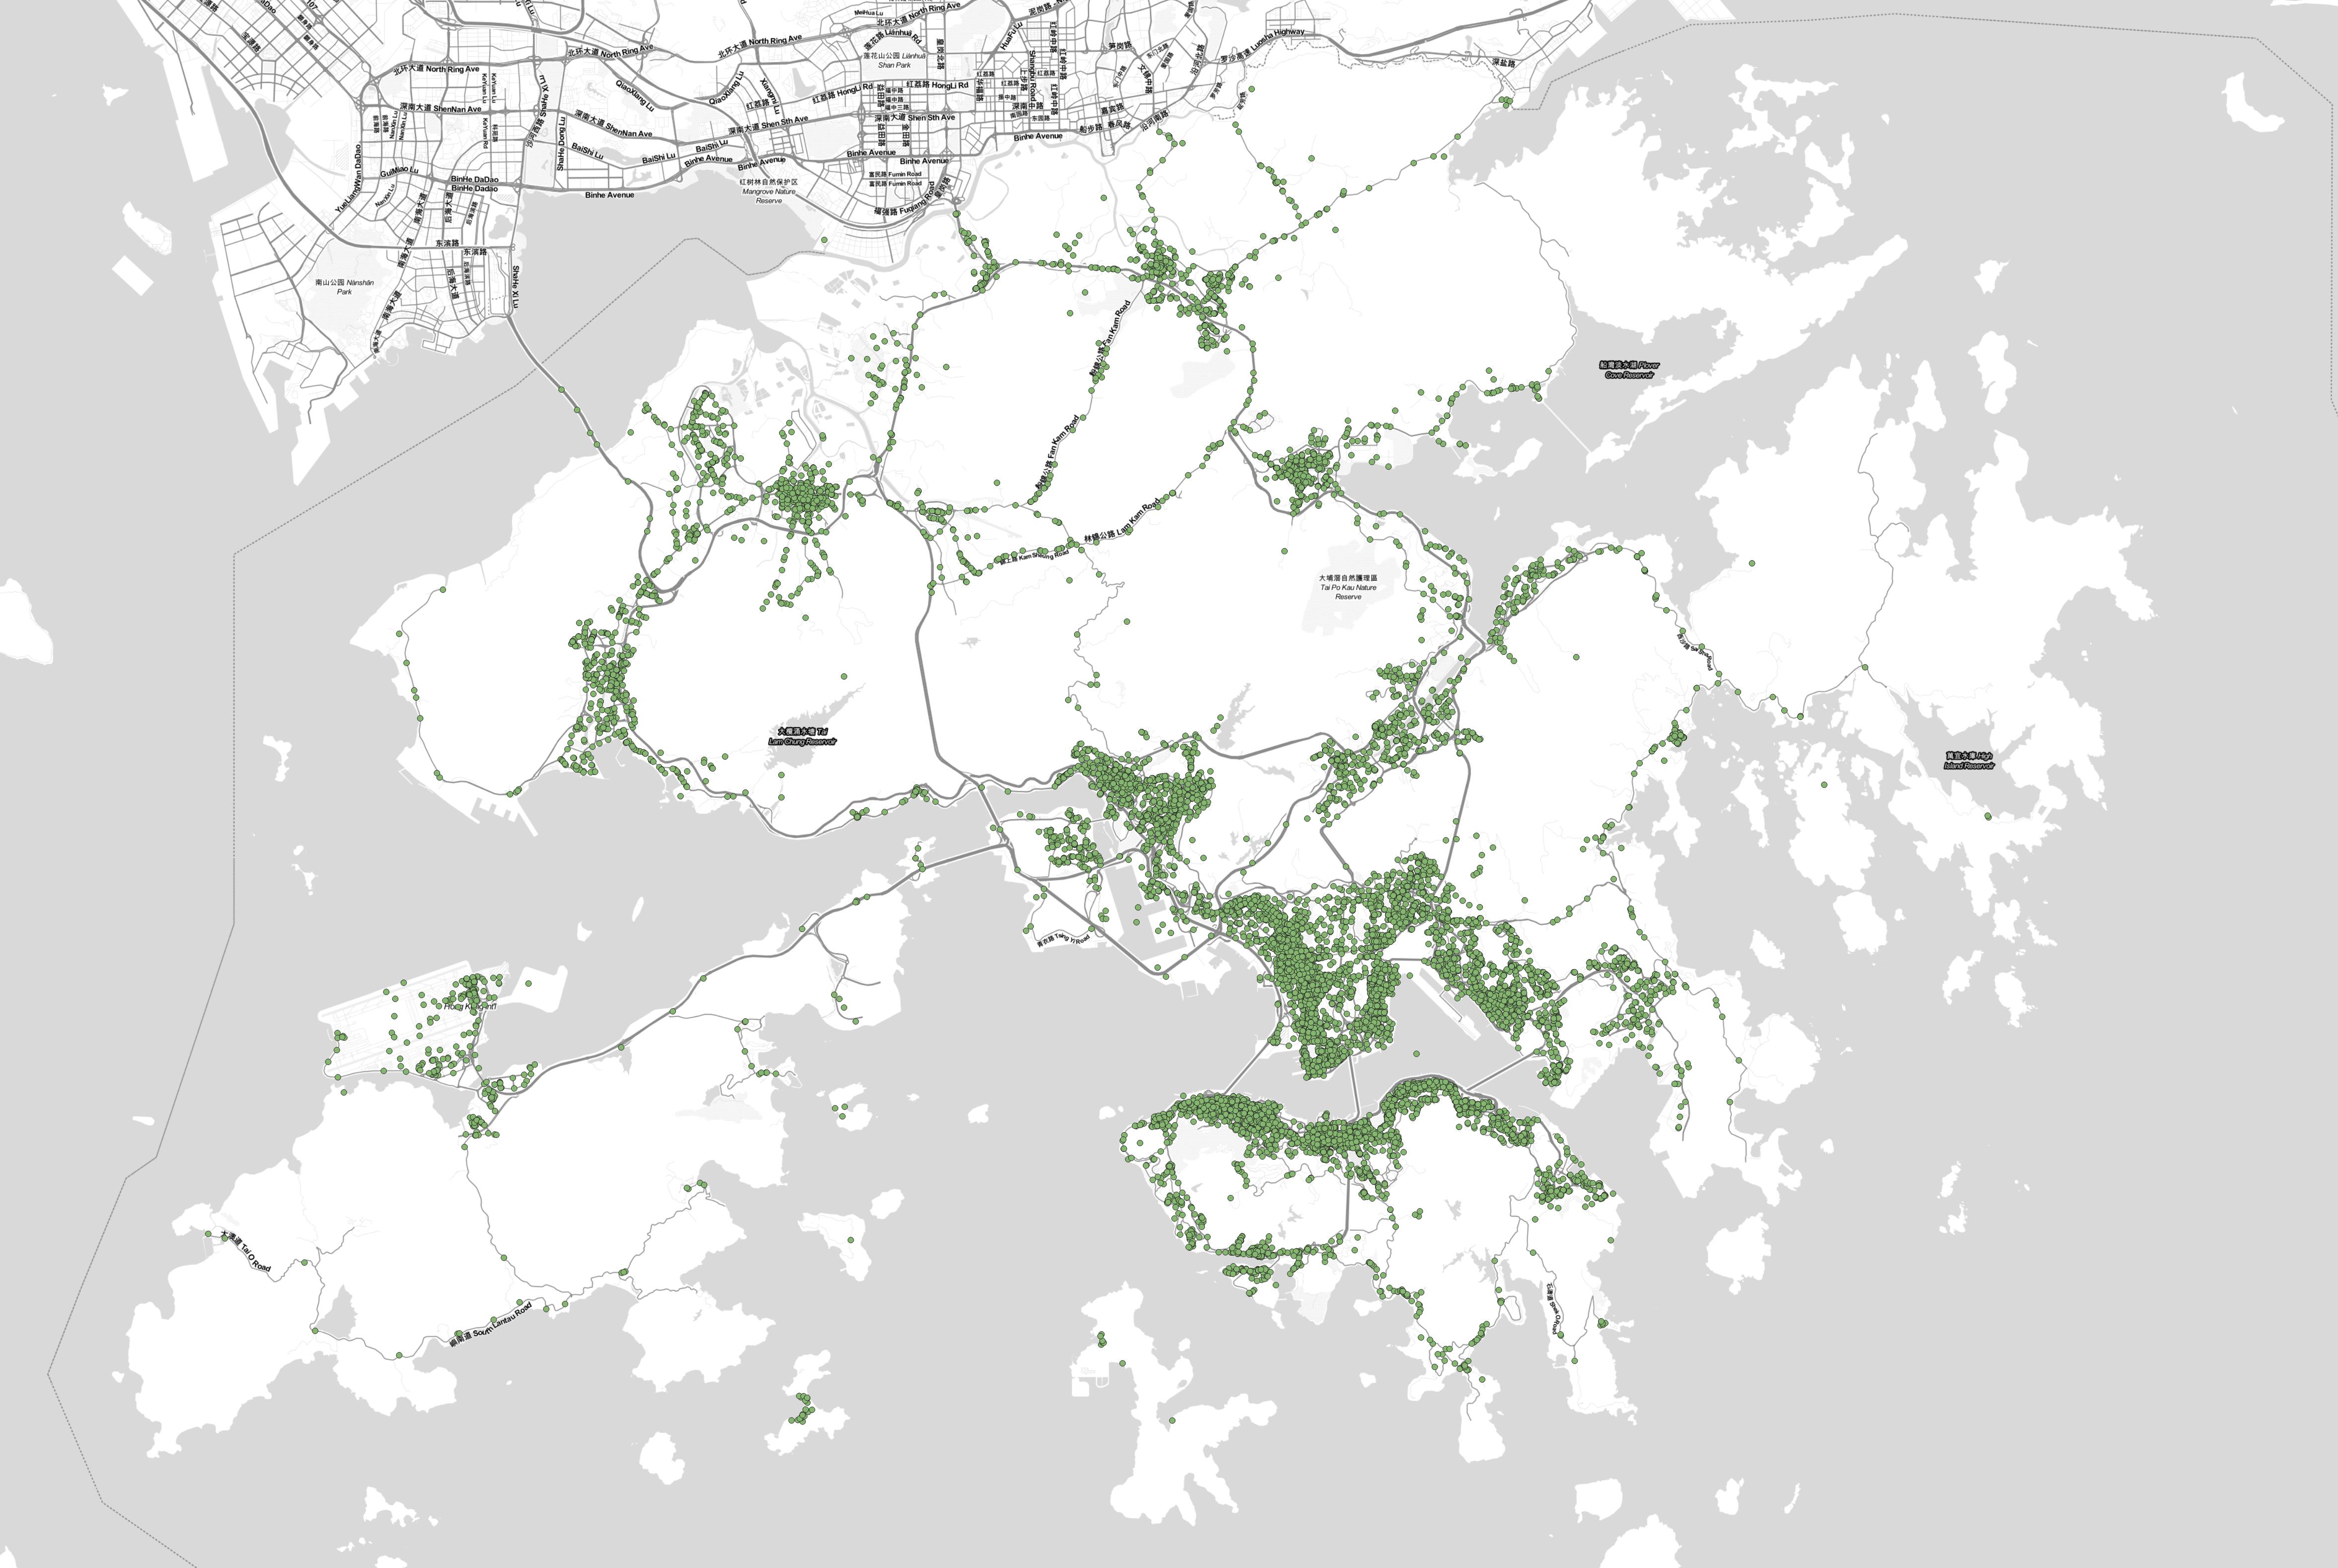
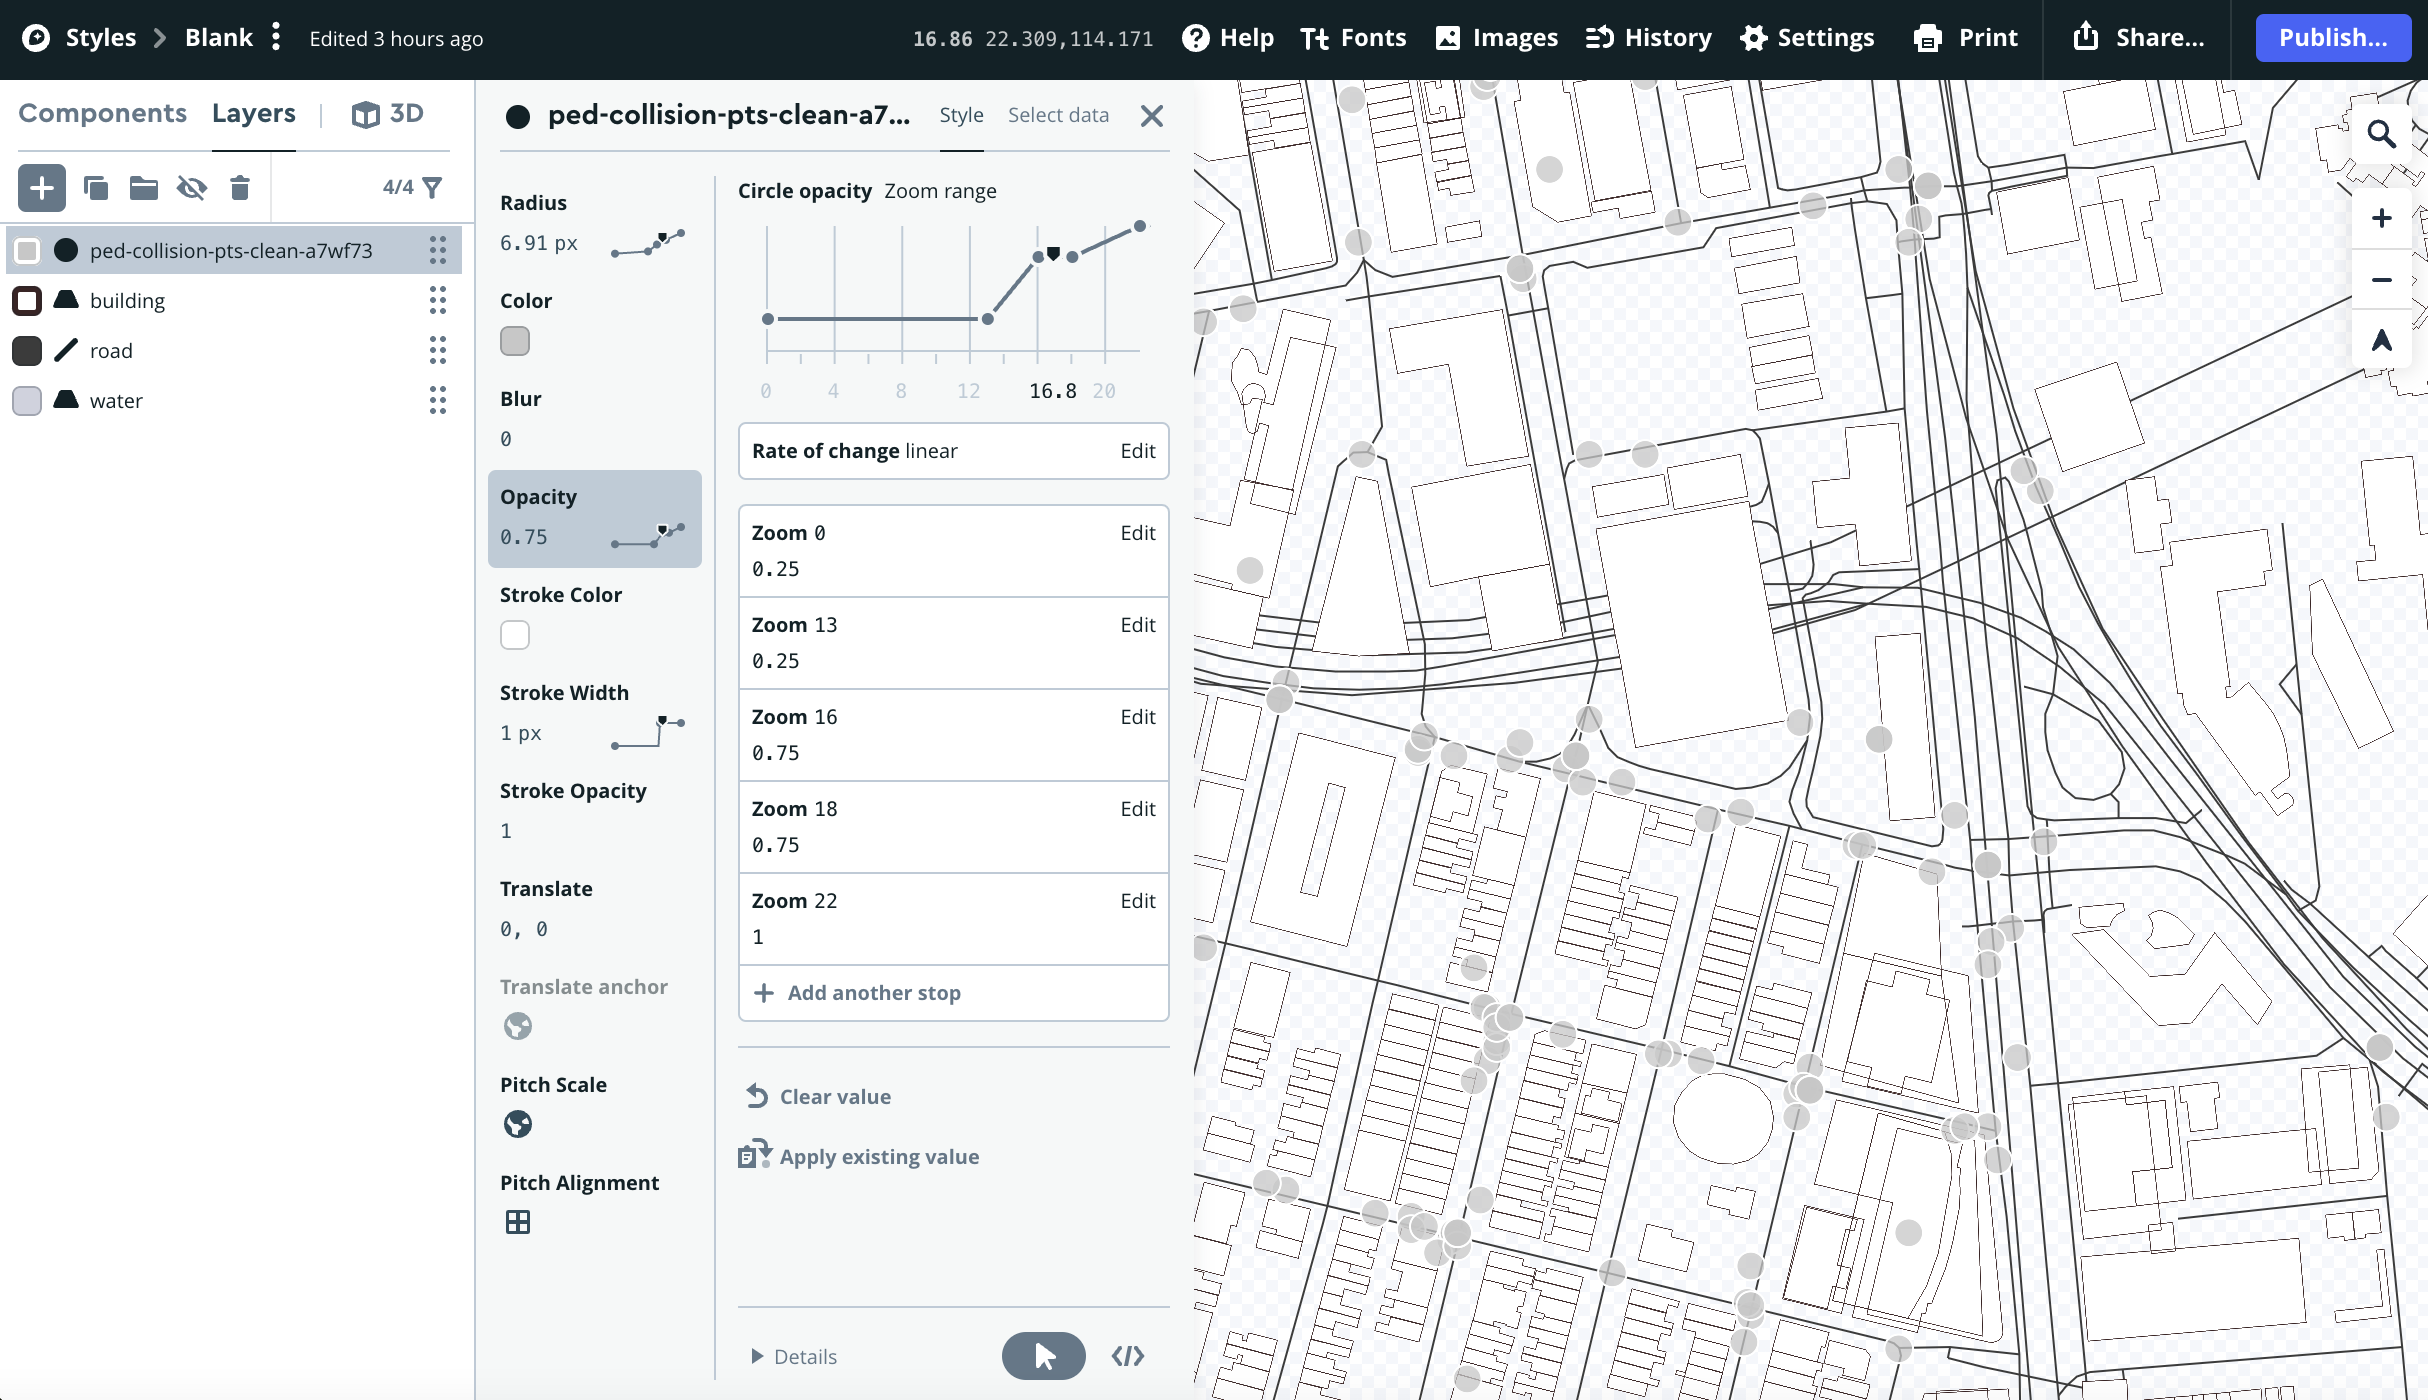
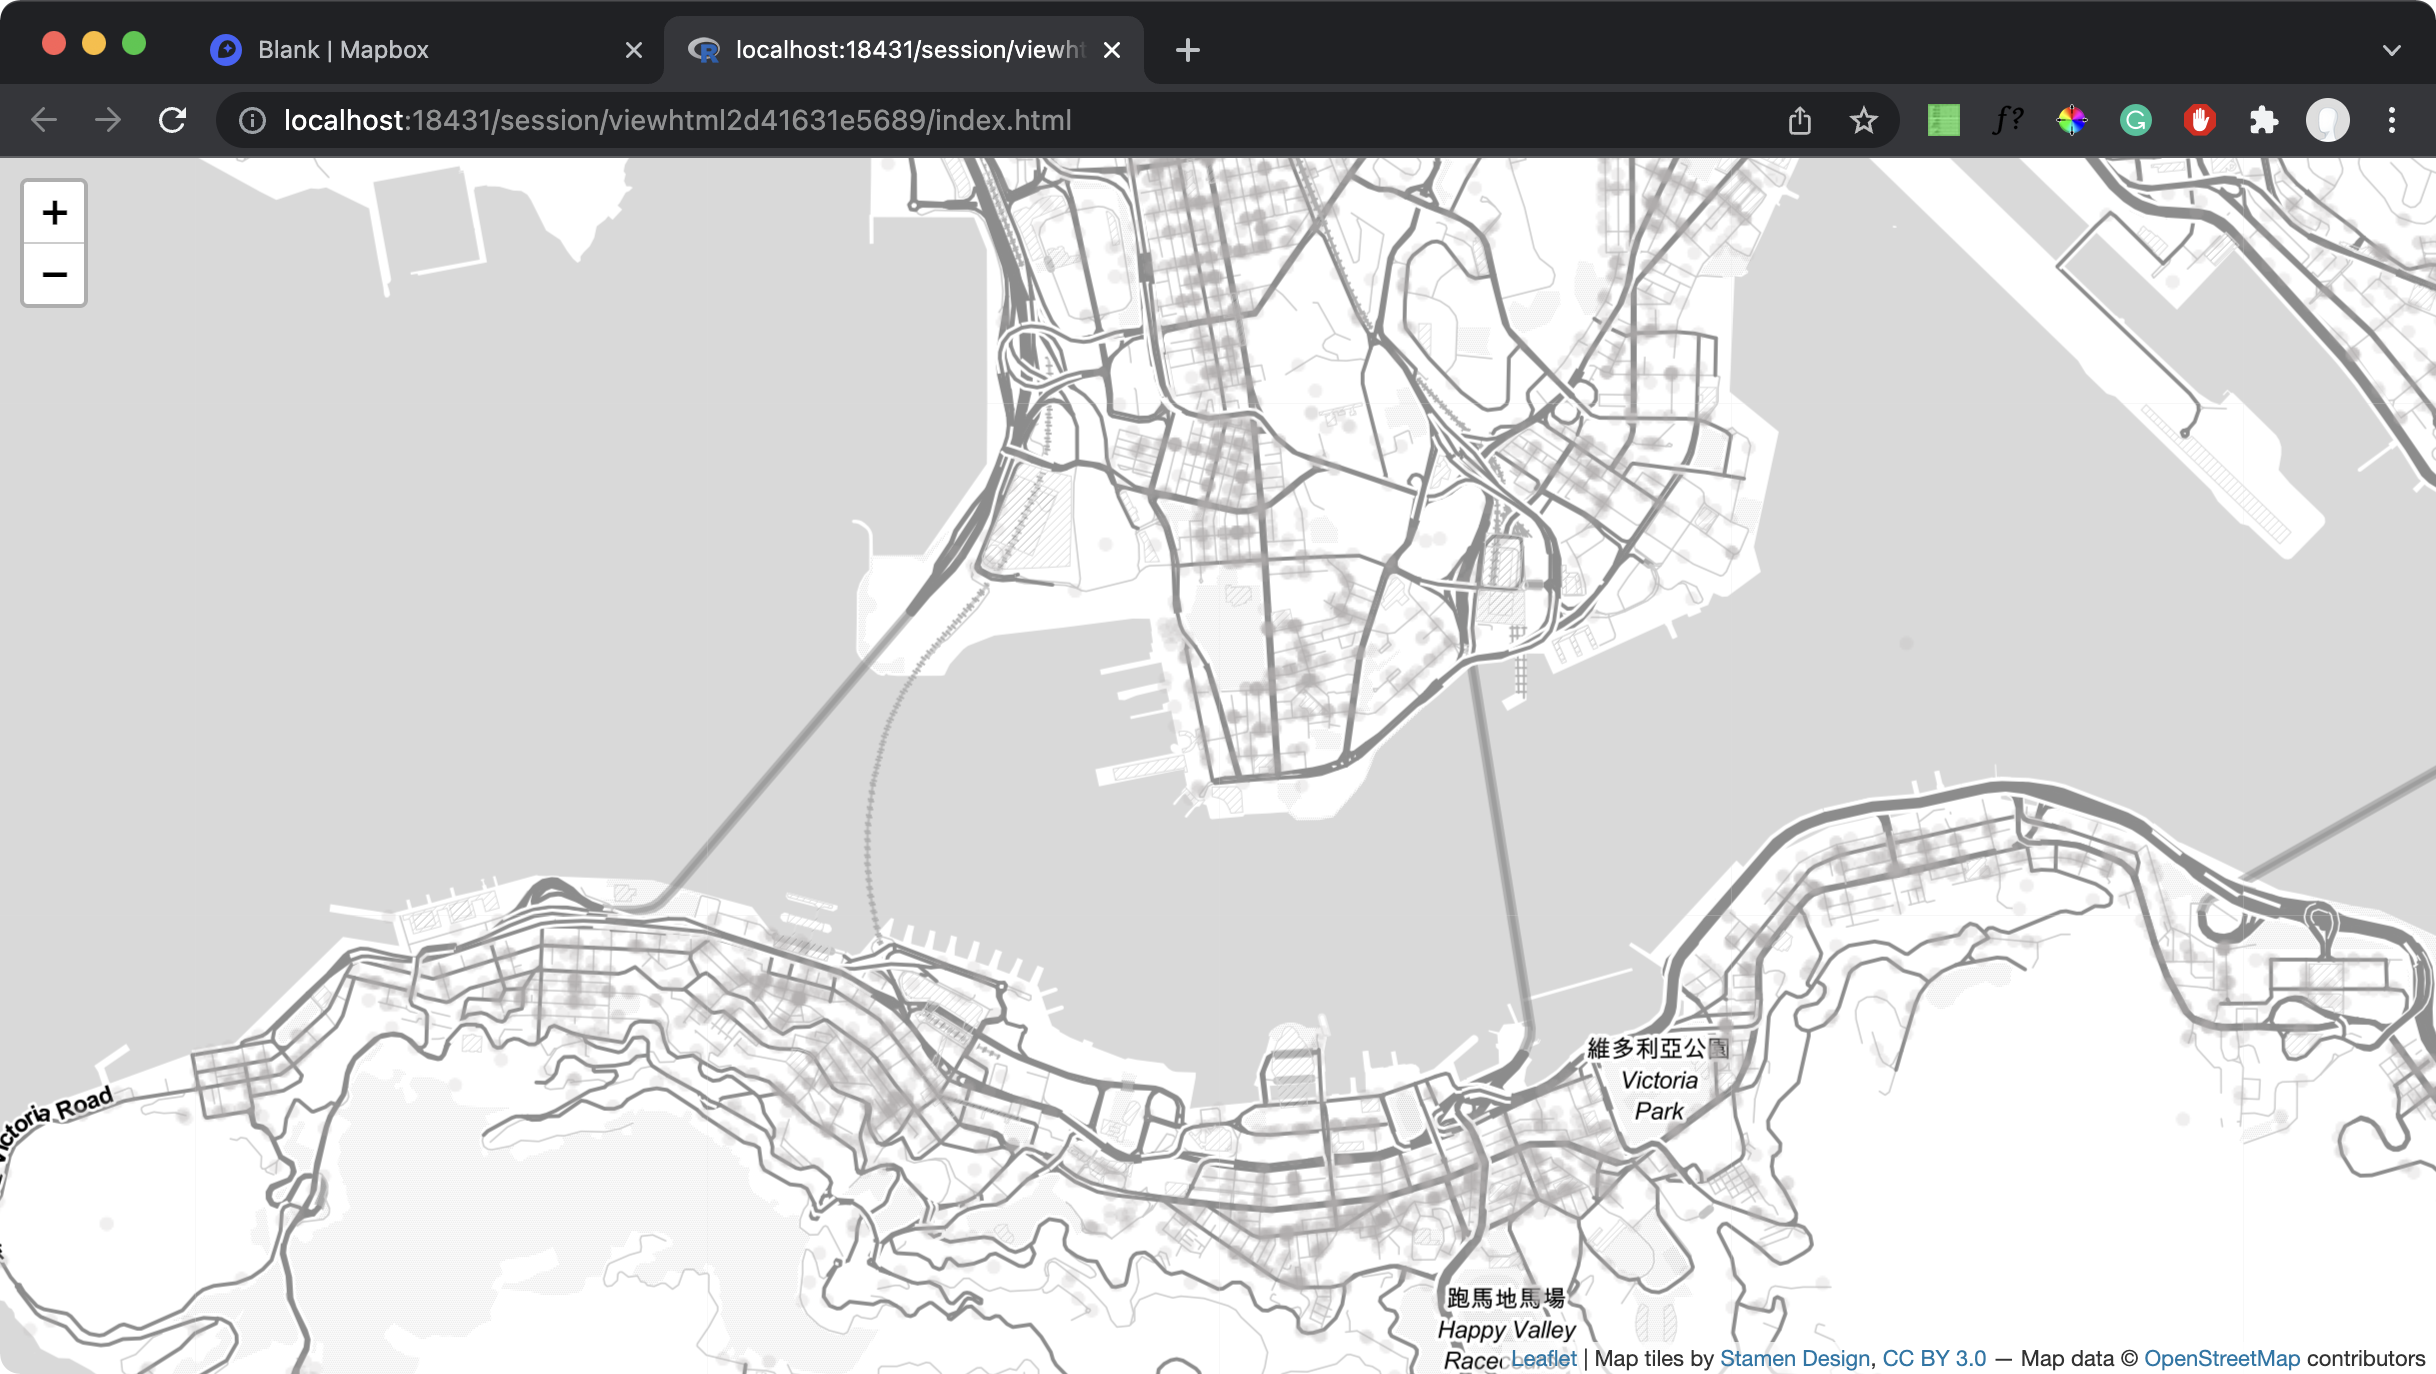
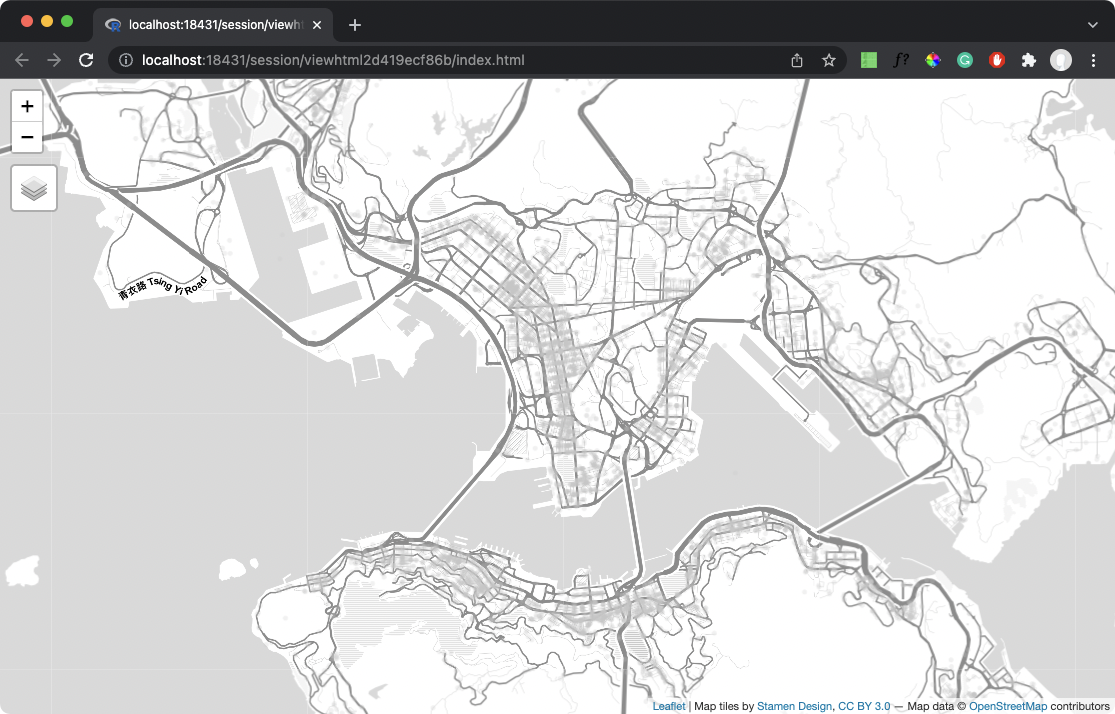
The details of refining the styles is beyond this jot (feel free to read us I dun wanna spend time writing this). A one-line summary is that I gradually increases the radius & opacity of the points when zoom level is larger, as well as add a white outline stroke to the circle symbols when zoom level is larger than 15. By this way, when zoomed-out, the points would be extremely pale and do not “clutter” the map with a truckload of dark circle. Meanwhile, when zoomed-in, the exact location of the points could be clearly identified.
This fits the users expectation in different zoom-level: when zoomed-out to the territory level, they want to get a quick grasp of the rough spatial distribution of the points (darker grey area means more collisions); while when zoomed-in to street-level, they would like to know the exact location where the points are located.
Step 3: Publish and share style
Click the Publish… button on the top-right of the page and Mapbox will handle all configuration matters, and the basemap created will be immediately ready to use! Much simpler than I imagined!
After click on the Share… button on the top right corner, a window pops out and allows you to share the basemap / map tiles with various means.

Check map service deployed successfully
The Add Mapbox maps as layers in ArcGIS and QGIS with WMTS in Mapbox Tutorial already fully documented steps required to add the basemap created as a WMTS layer to GIS. Below is an example showing how the results looks like.
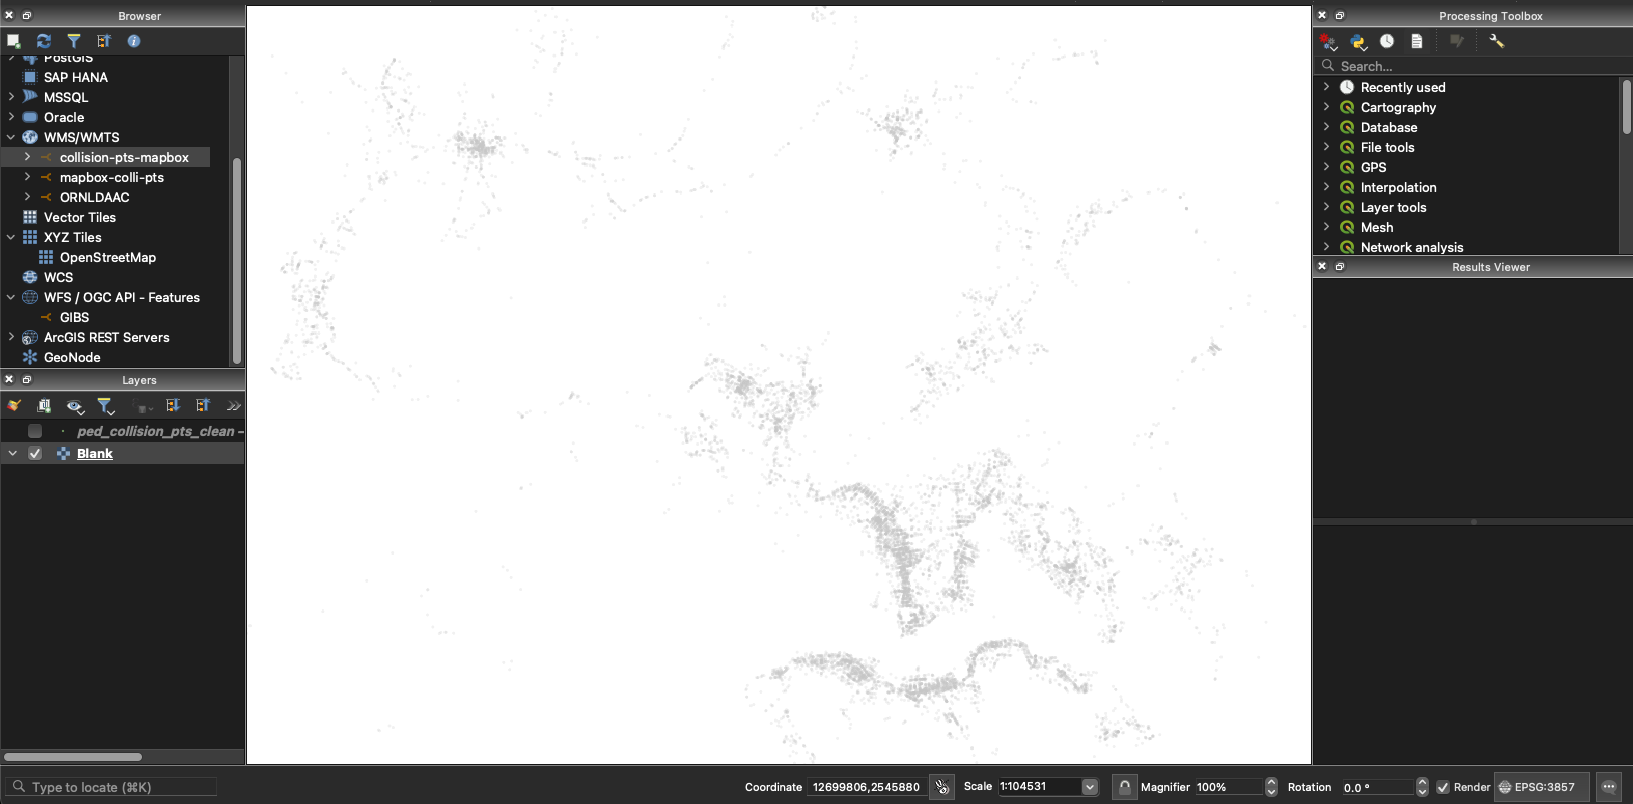
NOTE: The default WMTS bounding box is the whole earth with earth Mercator projection (EPSG:3857). If you use the Zoom to Layer(s) function to preview the WMTS layer, it will show the whole earth instead of the area with points (aka Hong Kong).
Step 4: Add the basemap as tile service in leaflet / tmap in R
Back to R and leaflet: How could I add that great map to the leaflet maps in R?
You can add a Mapbox Studio style to a Leaflet map using this endpoint with the
L.TileLayerclass:
Basically, in addition to WMTS, Mapbox also create tile services of the style just published as basemap tiles in the de facto XYZ standard. In the XYZ standard, static images (i.e. map tiles) are served through a Web server, with a URL like https://.../Z/X/Y.png, where Z is the zoom level, and X and Y identify the tile (from Wikipedia - Tiled Web Map).
The URL to access the XYZ standard basemap is in the format of:
https://api.mapbox.com/styles/v1/YOUR_USERNAME/YOUR_STYLE_ID/tiles/256/{z}/{x}/{y}?access_token=YOUR_MAPBOX_ACCESS_TOKEN
This endpoint is exactly what we want! With a few lines of code (always feel amused how programmers concentrate tons of computer processes into one single function!), I could add the point layer tile to a leaflet map in R with addTiles function.
COLLISION_PTS_TILE_URL = "THE_XYZ_BASEMAP_ENDPOINT_FROM_MAPBOX"

leaflet() %>%
  setView(lng = 114.2, lat = 22.3, zoom = 12) %>%
  addProviderTiles("Stamen.TonerLite") %>%
  addTiles(
    # Add tile from mapbox style
    # https://docs.mapbox.com/studio-manual/guides/publish-your-style/
    urlTemplate = COLLISION_PTS_TILE_URL
  )
In tmap, it is possible to add the tiles with the tm_tiles function.
tmap_mode("view")
tmap_options(basemaps = c("Stamen.TonerLite"))

COLLISION_PTS_TILE_URL = "THE_XYZ_BASEMAP_ENDPOINT_FROM_MAPBOX"

tm_tiles(COLLISION_PTS_TILE_URL, group = "Collisions with pedestrian injuries")
As a side-note, addWMSTiles() function is available in the leaflet package, yet I am no sure why the tile map do not show. I checked the Loading WMS layer in R leaflet using addWMSTiles and R - Leaflet WMTS layer is not rendering SO questions and still could not figure out the reasons behind. Worth some further investigations.
Let’s sum it up
This is what I have done through the journey:
- Create a new style in Mapbox and add custom data
- Adjust the symbologies of the data in different zoom levels to create a basemap
- Publish the basemap
- View the basemap as WMTS tile and XYZ tile
- Add the basemap to R with leaflet/tmap
Appendix: Some fail attempts
I tried to Manually create tiles in QGIS, following the Creating Basemaps with QTiles tutorial, yet with no luck finding ways to deploy the map tiles.
I also tried to export the symbolised point view as a geotiff image, then import to R with raster/terra package. However, the rendered geotiff image has a size of ~30 MB, even for 150 DPI images. And the pixelation of the image is horrible that I am sure users will literally scream the hell out if it.
Still, I learned something new during the fail attempts: it is possible to export a geotiff with transparency (i.e. NoData) in QGIS. I only know this after reading the answer from the Exporting raster with transparency from QGIS StackExchange question.
References
Using custom tiles in an RStudio Leaflet map
Mapbox Studio manual - Tilesets
What are the Differences Between TMS, XYZ & WMTS?
- A GIS StackExchange question about the definitions of 3 major tile serving protocal
- Introduction article to several web mapping concpets, including Zoom Levels, X Y coordinates and Map tile API format